AUC (Area Under the Curve) measures a model's ability to distinguish between classes by evaluating the trade-off between true positive and false positive rates, making it more robust for imbalanced datasets than accuracy. Accuracy calculates the proportion of correct predictions but can be misleading when class distribution is uneven or when model confidence varies. Choosing AUC over accuracy provides a deeper understanding of classification performance, particularly in scenarios where false positives and false negatives carry different costs.
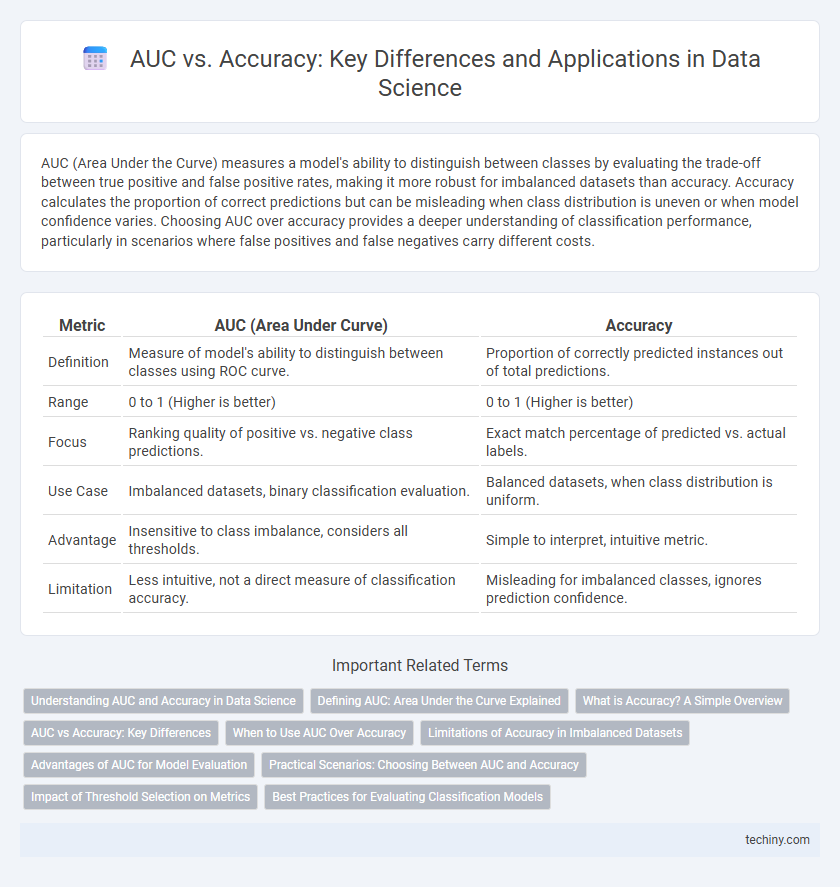
Table of Comparison
| Metric | AUC (Area Under Curve) | Accuracy |
|---|---|---|
| Definition | Measure of model's ability to distinguish between classes using ROC curve. | Proportion of correctly predicted instances out of total predictions. |
| Range | 0 to 1 (Higher is better) | 0 to 1 (Higher is better) |
| Focus | Ranking quality of positive vs. negative class predictions. | Exact match percentage of predicted vs. actual labels. |
| Use Case | Imbalanced datasets, binary classification evaluation. | Balanced datasets, when class distribution is uniform. |
| Advantage | Insensitive to class imbalance, considers all thresholds. | Simple to interpret, intuitive metric. |
| Limitation | Less intuitive, not a direct measure of classification accuracy. | Misleading for imbalanced classes, ignores prediction confidence. |
Understanding AUC and Accuracy in Data Science
AUC (Area Under the Curve) measures a model's ability to distinguish between classes by evaluating the trade-off between true positive and false positive rates in binary classification tasks. Accuracy quantifies the proportion of correct predictions out of all predictions but can be misleading in imbalanced datasets. In data science, AUC provides a more robust metric for model evaluation, especially when class distributions are skewed, whereas accuracy remains useful for balanced datasets with equal class representation.
Defining AUC: Area Under the Curve Explained
AUC, or Area Under the Curve, quantifies the performance of a classification model by measuring the entire two-dimensional area underneath the Receiver Operating Characteristic (ROC) curve, which plots true positive rate against false positive rate at various threshold settings. Unlike accuracy, which calculates the ratio of correct predictions to total predictions, AUC evaluates the model's ability to distinguish between classes regardless of classification threshold. This metric is particularly valuable in imbalanced datasets, providing a robust measure of model discrimination beyond simple correct or incorrect labels.
What is Accuracy? A Simple Overview
Accuracy measures the proportion of correctly classified instances in a dataset, calculated as the ratio of true positives and true negatives to the total number of predictions. It provides a straightforward metric for model performance but can be misleading in imbalanced datasets where one class dominates. In data science, accuracy is often complemented by metrics like AUC to better evaluate classification models.
AUC vs Accuracy: Key Differences
AUC measures the overall ability of a classification model to distinguish between classes across all thresholds, providing a performance metric independent of the classification cutoff. Accuracy calculates the proportion of correctly classified instances based on a specific threshold, potentially misleading in imbalanced datasets. While accuracy reflects the model's success at a fixed decision point, AUC offers a comprehensive evaluation of model ranking capability and discrimination power.
When to Use AUC Over Accuracy
AUC is preferred over accuracy when dealing with imbalanced datasets because it evaluates model performance across all classification thresholds, capturing the trade-off between true positive and false positive rates. Accuracy can be misleading in skewed classes, as it may reflect high performance by simply predicting the majority class. AUC provides a more robust metric for model comparison in scenarios where class distribution and misclassification costs vary.
Limitations of Accuracy in Imbalanced Datasets
Accuracy often fails to reflect true model performance in imbalanced datasets, as it can be misleading when the majority class dominates predictions. The Area Under the Curve (AUC) evaluates the trade-off between true positive and false positive rates across thresholds, providing a more nuanced assessment. Unlike accuracy, AUC remains robust by capturing the model's discriminative ability regardless of class distribution.
Advantages of AUC for Model Evaluation
AUC (Area Under the Curve) provides a robust evaluation metric by measuring a model's ability to distinguish between classes across all threshold levels, making it more reliable than accuracy in imbalanced datasets. It captures the trade-off between true positive rate and false positive rate, facilitating better insights into model performance beyond simple correctness percentage. Furthermore, AUC remains unaffected by class distribution shifts, offering stable evaluation for models deployed in real-world scenarios with varying data proportions.
Practical Scenarios: Choosing Between AUC and Accuracy
In practical scenarios, AUC is preferred over accuracy when dealing with imbalanced datasets because it evaluates model performance across all classification thresholds, providing a more comprehensive measure of discrimination ability. Accuracy may be misleading when class distributions are skewed, as it can overstate performance by favoring the majority class. For balanced datasets and clear-cut classification tasks, accuracy offers an intuitive and straightforward metric for assessing model correctness.
Impact of Threshold Selection on Metrics
Threshold selection dramatically influences the balance between sensitivity and specificity in classification models, affecting the AUC and accuracy metrics differently. AUC evaluates model performance across all possible thresholds, providing a comprehensive measure of discriminative ability, while accuracy depends on a single chosen threshold, potentially misleading when class distributions are imbalanced. Optimizing the threshold based on precision-recall trade-offs or cost-sensitive criteria enhances practical decision-making beyond relying solely on accuracy scores.
Best Practices for Evaluating Classification Models
AUC (Area Under the ROC Curve) measures a classification model's ability to distinguish between classes across different threshold settings, providing a comprehensive performance metric especially for imbalanced datasets. Accuracy reflects the proportion of correct predictions but can be misleading when class distribution is skewed or misclassification costs differ. Best practices for evaluating classification models recommend prioritizing AUC to capture sensitivity and specificity balance, supplemented by accuracy for overall correctness in balanced scenarios.
AUC vs accuracy Infographic