Exploratory Data Analysis (EDA) focuses on summarizing and visualizing data to uncover patterns, spot anomalies, and test hypotheses without making formal inferences. Inferential Data Analysis uses statistical models and probability theory to draw conclusions about a population based on sample data, enabling predictions and decision-making under uncertainty. Both approaches complement each other, with EDA guiding the choice of models and assumptions for inferential analysis.
Table of Comparison
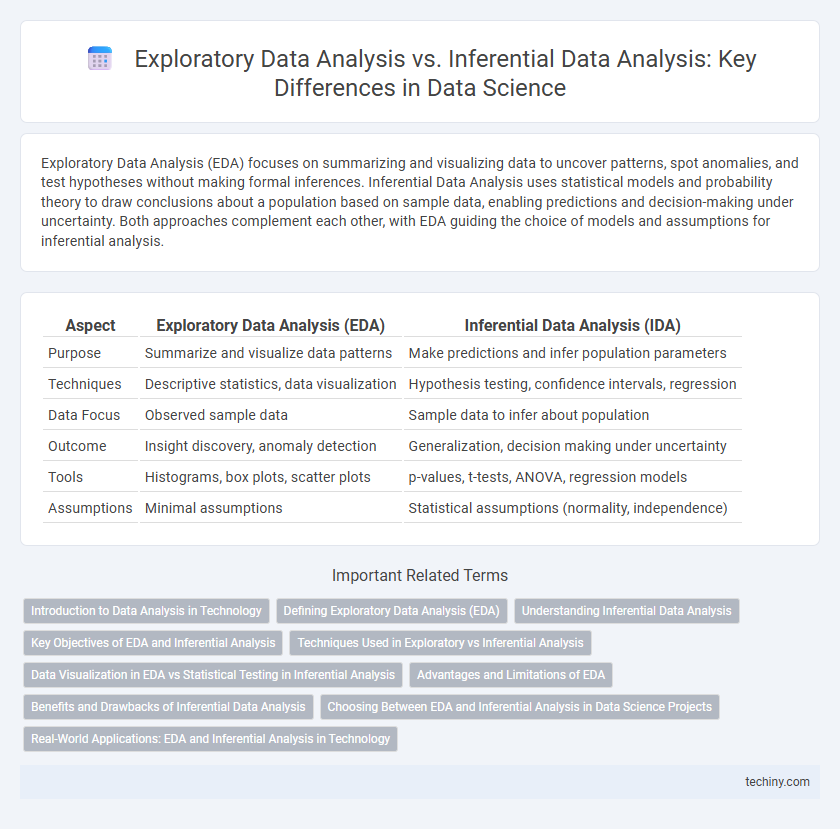
| Aspect | Exploratory Data Analysis (EDA) | Inferential Data Analysis (IDA) |
|---|---|---|
| Purpose | Summarize and visualize data patterns | Make predictions and infer population parameters |
| Techniques | Descriptive statistics, data visualization | Hypothesis testing, confidence intervals, regression |
| Data Focus | Observed sample data | Sample data to infer about population |
| Outcome | Insight discovery, anomaly detection | Generalization, decision making under uncertainty |
| Tools | Histograms, box plots, scatter plots | p-values, t-tests, ANOVA, regression models |
| Assumptions | Minimal assumptions | Statistical assumptions (normality, independence) |
Introduction to Data Analysis in Technology
Exploratory Data Analysis (EDA) involves summarizing and visualizing data to uncover patterns, anomalies, and initial insights using statistical graphics and descriptive statistics. Inferential Data Analysis applies probability theory to draw conclusions and make predictions about a population based on sample data, utilizing hypothesis testing, confidence intervals, and regression analysis. Together, these methods form the foundation of data analysis in technology, enabling data scientists to extract meaningful information and guide decision-making processes effectively.
Defining Exploratory Data Analysis (EDA)
Exploratory Data Analysis (EDA) is a critical data science technique used to summarize main characteristics of a dataset, often using visual methods like histograms, scatter plots, and box plots. EDA helps identify patterns, anomalies, or initial hypotheses without making formal statistical inferences. This process enables data scientists to understand data distributions, detect outliers, and guide subsequent inferential data analysis steps.
Understanding Inferential Data Analysis
Inferential Data Analysis enables drawing conclusions about a population based on a sample, using statistical tests and confidence intervals to make predictions or generalizations. It applies hypothesis testing, estimation, and regression techniques to infer relationships and trends beyond the observed data. This approach is essential for decision-making and validating models in data science by quantifying uncertainty and assessing statistical significance.
Key Objectives of EDA and Inferential Analysis
Exploratory Data Analysis (EDA) focuses on summarizing main data characteristics through visualizations and statistics to uncover patterns, detect anomalies, and test hypotheses informally. Inferential Data Analysis aims to draw conclusions about a population based on sample data using hypothesis testing, estimation, and confidence intervals. Key objectives of EDA include data cleaning and insight generation, while inferential analysis prioritizes making generalizations and predictions with quantifiable uncertainty.
Techniques Used in Exploratory vs Inferential Analysis
Exploratory Data Analysis (EDA) employs techniques such as summary statistics, data visualization (histograms, box plots, scatter plots), and clustering methods to identify patterns and anomalies within datasets. Inferential Data Analysis relies on hypothesis testing, confidence intervals, regression analysis, and probability distributions to draw conclusions about population parameters based on sample data. While EDA focuses on uncovering initial insights without formal assumptions, inferential methods apply statistical models to make predictions and generalizations beyond the observed data.
Data Visualization in EDA vs Statistical Testing in Inferential Analysis
Data visualization in Exploratory Data Analysis (EDA) leverages graphs, charts, and plots to uncover patterns, anomalies, and relationships within datasets, providing intuitive insights without formal hypothesis testing. In contrast, Inferential Data Analysis relies on statistical testing methods such as t-tests, chi-square tests, and confidence intervals to draw conclusions about populations based on sample data, quantifying uncertainty and validating hypotheses. EDA's visual tools enhance data understanding and guide model selection, while inferential statistics ensure rigorous decision-making and generalizability of findings.
Advantages and Limitations of EDA
Exploratory Data Analysis (EDA) excels at uncovering patterns, detecting outliers, and visualizing data distributions, enabling data scientists to gain intuitive insights before formal modeling. EDA's non-parametric nature allows flexibility without strict assumptions, but it lacks the rigor to make generalized inferences about populations, limiting its ability to test hypotheses statistically. While essential for data cleaning and hypothesis generation, EDA alone cannot provide definitive conclusions or predictive power without complementary inferential techniques.
Benefits and Drawbacks of Inferential Data Analysis
Inferential Data Analysis enables predictions about populations based on sample data, making it essential for hypothesis testing and generalization beyond observed data. Its benefits include providing confidence intervals and significance testing, which support data-driven decision-making. However, drawbacks involve reliance on assumptions like normality and sample representativeness, which, if unmet, can lead to misleading conclusions.
Choosing Between EDA and Inferential Analysis in Data Science Projects
Choosing between Exploratory Data Analysis (EDA) and Inferential Data Analysis in data science projects depends on the project goals and data characteristics. EDA is essential for uncovering patterns, outliers, and initial insights through visualization and summary statistics, while Inferential Data Analysis focuses on hypothesis testing, confidence intervals, and making predictions about populations from sample data. Prioritizing EDA is crucial in early project stages for data understanding, whereas inferential methods are vital when validating hypotheses and making data-driven decisions.
Real-World Applications: EDA and Inferential Analysis in Technology
Exploratory Data Analysis (EDA) enables technology companies to uncover hidden patterns and anomalies in large datasets, optimizing algorithms for customer behavior and product recommendations. Inferential Data Analysis supports decision-making in technology by allowing engineers to draw conclusions about user trends and system performance from sample data, facilitating predictive maintenance and A/B testing. Both EDA and inferential methods drive innovation in artificial intelligence development and enhance data-driven strategies across software and hardware platforms.
Exploratory Data Analysis vs Inferential Data Analysis Infographic