Statistical power measures the probability of correctly rejecting a false null hypothesis, directly influenced by effect size, sample size, and significance level. Larger effect sizes increase statistical power, making it easier to detect meaningful patterns in data science experiments. Balancing statistical power and effect size is essential for designing reliable studies and avoiding false negatives in data analysis.
Table of Comparison
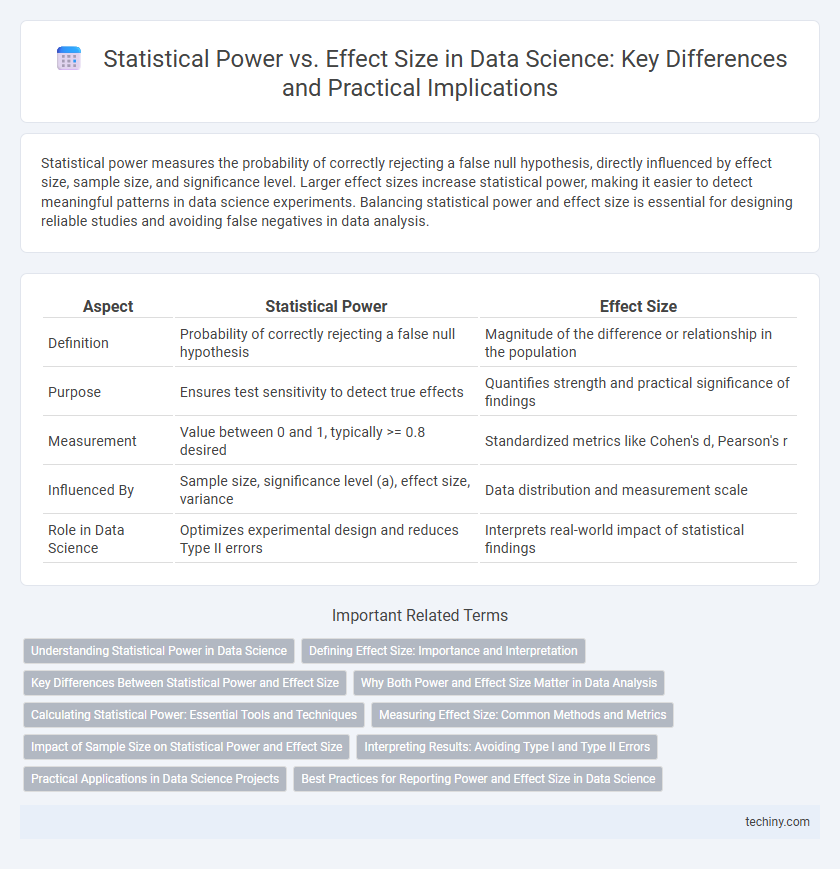
| Aspect | Statistical Power | Effect Size |
|---|---|---|
| Definition | Probability of correctly rejecting a false null hypothesis | Magnitude of the difference or relationship in the population |
| Purpose | Ensures test sensitivity to detect true effects | Quantifies strength and practical significance of findings |
| Measurement | Value between 0 and 1, typically >= 0.8 desired | Standardized metrics like Cohen's d, Pearson's r |
| Influenced By | Sample size, significance level (a), effect size, variance | Data distribution and measurement scale |
| Role in Data Science | Optimizes experimental design and reduces Type II errors | Interprets real-world impact of statistical findings |
Understanding Statistical Power in Data Science
Statistical power in data science measures the probability of correctly rejecting a false null hypothesis, directly influenced by effect size, sample size, and significance level. A higher effect size increases statistical power, making it easier to detect true relationships in data-driven models and experiments. Optimizing statistical power ensures robust predictive analytics and reliable insights for data-driven decision-making.
Defining Effect Size: Importance and Interpretation
Effect size is a quantitative measure that reflects the magnitude of a phenomenon or the strength of a relationship within data, crucial for interpreting the practical significance in statistical analyses. It complements statistical power by enabling researchers to assess whether observed effects are meaningful beyond mere statistical significance. Understanding effect size informs data-driven decision-making by highlighting the real-world impact and guiding sample size requirements in data science projects.
Key Differences Between Statistical Power and Effect Size
Statistical power measures the probability of correctly rejecting a false null hypothesis, directly influenced by sample size, effect size, significance level, and variability. Effect size quantifies the magnitude of a phenomenon or relationship, independent of sample size, often expressed as Cohen's d, Pearson's r, or odds ratio. The key difference lies in statistical power reflecting the test's ability to detect an effect, while effect size indicates the practical significance of the observed effect.
Why Both Power and Effect Size Matter in Data Analysis
Statistical power determines the likelihood of correctly rejecting a false null hypothesis, while effect size quantifies the magnitude of a phenomenon in data analysis. High statistical power reduces the risk of Type II errors, ensuring true effects are detected, whereas effect size provides context on the practical significance of findings. Balancing both metrics is essential to draw meaningful, reliable conclusions and optimize experimental design in data science.
Calculating Statistical Power: Essential Tools and Techniques
Calculating statistical power involves using tools such as power analysis software, including G*Power and R packages like pwr, to estimate the probability of correctly rejecting a false null hypothesis. Key techniques include specifying effect size, significance level, sample size, and variance to determine the sensitivity of a test. Accurate power calculations optimize experimental design by balancing effect size detection and resource allocation.
Measuring Effect Size: Common Methods and Metrics
Measuring effect size in data science involves quantifying the magnitude of a relationship or difference, with common metrics including Cohen's d, Pearson's r, and odds ratio. Cohen's d measures standardized mean differences, essential for comparing group means in hypothesis testing. Pearson's r captures the strength and direction of linear associations between variables, while the odds ratio expresses the likelihood of an event occurring in one group relative to another, facilitating interpretation in logistic regression models.
Impact of Sample Size on Statistical Power and Effect Size
Sample size directly influences statistical power by reducing the standard error, which increases the likelihood of detecting a true effect when it exists. Larger samples enhance the precision of effect size estimates, leading to more reliable and valid conclusions in hypothesis testing. Insufficient sample sizes decrease statistical power, increasing the risk of Type II errors and masking meaningful effect sizes in data analysis.
Interpreting Results: Avoiding Type I and Type II Errors
Interpreting results in data science requires balancing statistical power and effect size to minimize Type I and Type II errors. A higher statistical power reduces the risk of false negatives (Type II errors), ensuring true effects are detected, while maintaining appropriate significance levels controls false positives (Type I errors). Carefully selecting sample size and effect size thresholds enhances result reliability and supports accurate decision-making in hypothesis testing.
Practical Applications in Data Science Projects
Statistical power quantifies the probability of detecting a true effect when it exists, while effect size measures the magnitude of that effect in data science experiments. In practical applications, optimizing statistical power ensures reliable identification of meaningful patterns, especially in large datasets or A/B testing scenarios. Balancing effect size and power guides data scientists in designing experiments that minimize Type II errors and maximize actionable insights.
Best Practices for Reporting Power and Effect Size in Data Science
Accurate reporting of statistical power and effect size enhances the credibility of data science findings by enabling clear interpretation of the study's sensitivity and the magnitude of observed effects. Best practices involve presenting power analysis results alongside effect sizes, specifying the sample size, significance level, and confidence intervals to provide comprehensive context. Utilizing standardized metrics such as Cohen's d or odds ratios ensures comparability across studies and fosters transparent communication of results in data science research.
Statistical Power vs Effect Size Infographic