Time Series Analysis examines data points collected or recorded at specific time intervals, enabling the identification of trends, seasonal patterns, and cyclical fluctuations. Cross-sectional Analysis surveys multiple subjects or entities at a single point in time to compare variations and relationships among variables across the dataset. Understanding the distinctions between these approaches is essential for selecting appropriate models that address temporal dynamics or snapshot comparisons in data science projects.
Table of Comparison
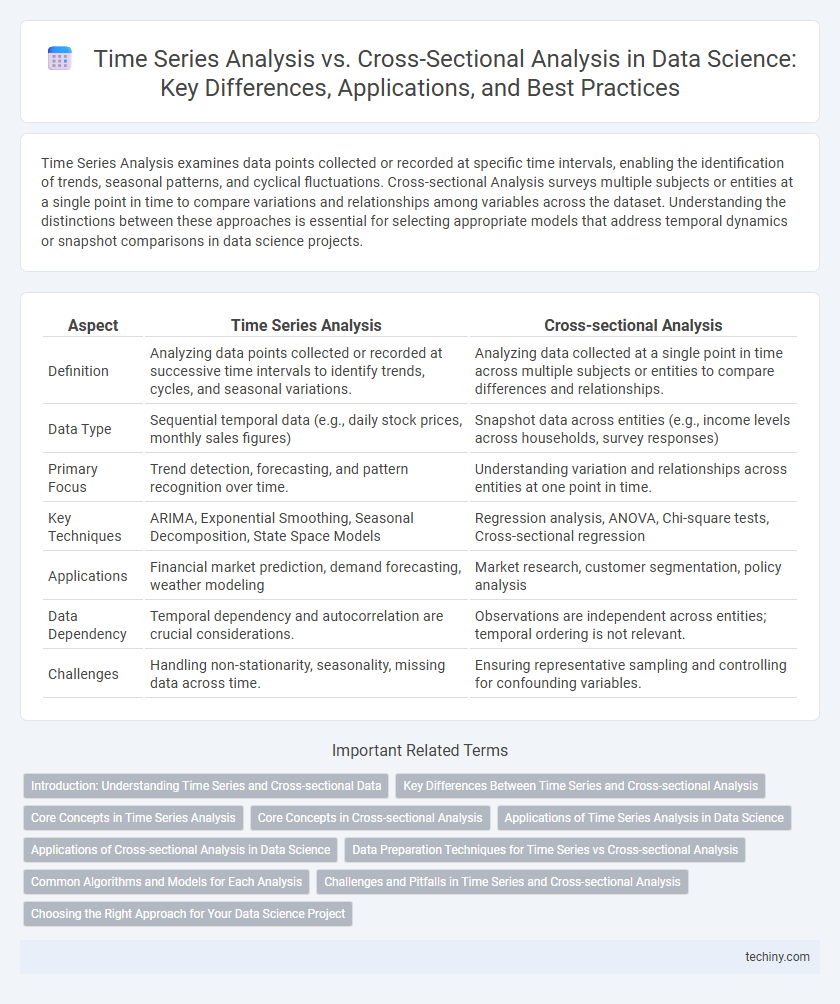
| Aspect | Time Series Analysis | Cross-sectional Analysis |
|---|---|---|
| Definition | Analyzing data points collected or recorded at successive time intervals to identify trends, cycles, and seasonal variations. | Analyzing data collected at a single point in time across multiple subjects or entities to compare differences and relationships. |
| Data Type | Sequential temporal data (e.g., daily stock prices, monthly sales figures) | Snapshot data across entities (e.g., income levels across households, survey responses) |
| Primary Focus | Trend detection, forecasting, and pattern recognition over time. | Understanding variation and relationships across entities at one point in time. |
| Key Techniques | ARIMA, Exponential Smoothing, Seasonal Decomposition, State Space Models | Regression analysis, ANOVA, Chi-square tests, Cross-sectional regression |
| Applications | Financial market prediction, demand forecasting, weather modeling | Market research, customer segmentation, policy analysis |
| Data Dependency | Temporal dependency and autocorrelation are crucial considerations. | Observations are independent across entities; temporal ordering is not relevant. |
| Challenges | Handling non-stationarity, seasonality, missing data across time. | Ensuring representative sampling and controlling for confounding variables. |
Introduction: Understanding Time Series and Cross-sectional Data
Time series analysis examines data points collected or recorded at specific, equally spaced time intervals to identify trends, seasonal patterns, and cyclical fluctuations. Cross-sectional analysis involves observing multiple subjects or units at a single point in time to compare differences or relationships across entities. Both methods are fundamental for extracting insights, with time series emphasizing temporal dynamics and cross-sectional analysis highlighting variations across categories or populations.
Key Differences Between Time Series and Cross-sectional Analysis
Time series analysis examines data points collected or recorded at specific time intervals to identify trends, seasonal patterns, and cyclic behaviors over time, making it essential for forecasting and monitoring dynamic processes. Cross-sectional analysis evaluates data collected at a single point in time across multiple subjects or entities, enabling comparisons and identifications of relationships between variables without considering temporal effects. The key differences lie in the temporal dimension, with time series focusing on data dynamics across time, while cross-sectional targets variability across units at one time, influencing methodologies such as autocorrelation tests in time series versus regression analysis in cross-sectional studies.
Core Concepts in Time Series Analysis
Time series analysis examines data points collected or recorded at specific time intervals to identify underlying patterns such as trends, seasonality, and cyclic behavior, enabling accurate forecasting and anomaly detection. Core concepts include stationarity, which ensures statistical properties remain constant over time, autocorrelation measuring the relationship between observations at different lags, and decomposition techniques that separate time series data into trend, seasonal, and residual components. Methods such as ARIMA models and exponential smoothing leverage these concepts to model temporal dependencies and improve predictive accuracy.
Core Concepts in Cross-sectional Analysis
Cross-sectional analysis examines data collected from multiple subjects at a single point in time, enabling the comparison of different entities such as individuals, companies, or regions. Key concepts include identifying relationships between variables, controlling for confounding factors, and using statistical techniques like regression analysis to infer patterns across the dataset. This approach is crucial for understanding variations and correlations without temporal influence, making it distinct from time series analysis that focuses on trends over time.
Applications of Time Series Analysis in Data Science
Time Series Analysis in Data Science is crucial for forecasting stock prices, analyzing sensor data in IoT, and monitoring economic indicators over time. Applications extend to demand forecasting in retail, predicting equipment failures in predictive maintenance, and evaluating trends in social media sentiment analysis. This method leverages temporal dependencies to uncover patterns, enabling data-driven decisions that adapt to changing conditions.
Applications of Cross-sectional Analysis in Data Science
Cross-sectional analysis in data science is primarily used for comparing multiple subjects at a single point in time, enabling businesses to identify patterns and correlations within diverse datasets. Common applications include customer segmentation, market basket analysis, and risk assessment in finance, where understanding variation across groups informs strategic decisions. This method supports predictive modeling by capturing snapshot insights that complement temporal trends from time series analysis.
Data Preparation Techniques for Time Series vs Cross-sectional Analysis
Time series analysis requires data preparation techniques such as trend decomposition, seasonality adjustment, and autocorrelation checks to ensure temporal dependencies are accurately captured. Cross-sectional analysis focuses on handling missing values, normalization, and feature selection across different entities at a single point in time. Both approaches emphasize data cleaning and transformation but diverge in techniques due to inherent temporal vs. static data structures.
Common Algorithms and Models for Each Analysis
Time series analysis commonly utilizes algorithms like ARIMA, Exponential Smoothing, and LSTM neural networks to model temporal dependencies and predict future values. Cross-sectional analysis often employs regression models, decision trees, and clustering algorithms to identify patterns and relationships within data collected at a single point in time. Both analyses prioritize feature selection and data preprocessing techniques specific to their temporal or static data structure.
Challenges and Pitfalls in Time Series and Cross-sectional Analysis
Time Series Analysis faces challenges such as autocorrelation, non-stationarity, and seasonality, which can lead to misleading inferences if not addressed properly. Cross-sectional Analysis struggles with confounding variables and simultaneity bias, complicating cause-effect relationships. Both methods require careful model specification and validation to avoid spurious results and ensure reliable insights.
Choosing the Right Approach for Your Data Science Project
Time series analysis focuses on data points collected or recorded at specific time intervals, enabling trend detection, forecasting, and seasonality analysis in fields such as finance, meteorology, and sales forecasting. Cross-sectional analysis examines data collected at a single point in time across multiple subjects or entities, ideal for understanding variations between groups or regions in areas like market research and social sciences. Selecting the right approach depends on whether the project demands temporal pattern recognition or comparative insights across independent units at one time.
Time Series Analysis vs Cross-sectional Analysis Infographic