Time series data captures observations sequentially over time, enabling trend analysis and forecasting, while cross-sectional data provides a snapshot of multiple variables at a single point in time for comparative analysis. Understanding the distinction is crucial for selecting appropriate statistical models and techniques that align with the dataset's temporal structure. Analysts leverage this knowledge to enhance predictive accuracy and infer relationships effectively within their data science projects.
Table of Comparison
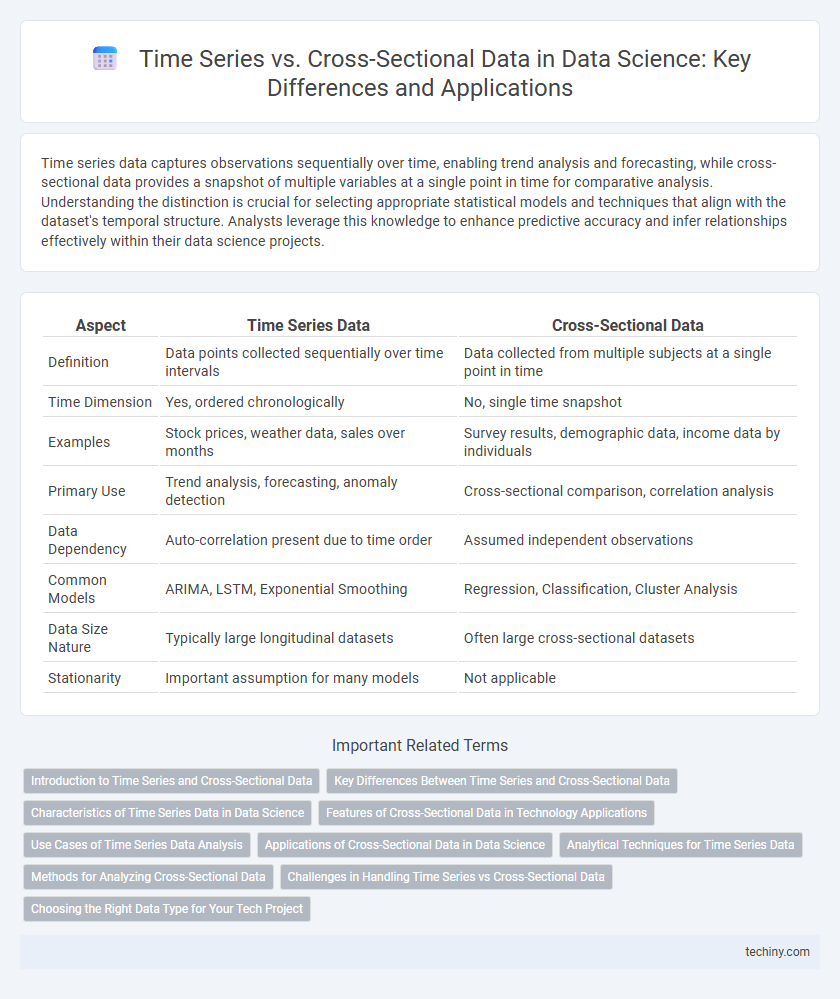
| Aspect | Time Series Data | Cross-Sectional Data |
|---|---|---|
| Definition | Data points collected sequentially over time intervals | Data collected from multiple subjects at a single point in time |
| Time Dimension | Yes, ordered chronologically | No, single time snapshot |
| Examples | Stock prices, weather data, sales over months | Survey results, demographic data, income data by individuals |
| Primary Use | Trend analysis, forecasting, anomaly detection | Cross-sectional comparison, correlation analysis |
| Data Dependency | Auto-correlation present due to time order | Assumed independent observations |
| Common Models | ARIMA, LSTM, Exponential Smoothing | Regression, Classification, Cluster Analysis |
| Data Size Nature | Typically large longitudinal datasets | Often large cross-sectional datasets |
| Stationarity | Important assumption for many models | Not applicable |
Introduction to Time Series and Cross-Sectional Data
Time series data consists of sequential observations recorded over consistent time intervals, enabling trend analysis, seasonality detection, and forecasting in data science. Cross-sectional data captures information from multiple subjects or entities at a single point in time, facilitating comparisons and identifying relationships across different units. Understanding the distinctions, such as the temporal ordering in time series versus the non-temporal snapshot nature of cross-sectional data, is fundamental for selecting appropriate analytical methods.
Key Differences Between Time Series and Cross-Sectional Data
Time series data captures observations of a single entity or phenomenon recorded at successive, evenly spaced time intervals, enabling analysis of trends, seasonality, and temporal dependencies. Cross-sectional data represents multiple entities or subjects measured at a single point in time, facilitating comparison across subjects without temporal context. Key differences include the temporal dimension in time series data versus the spatial or entity dimension in cross-sectional data, impacting statistical methods such as autoregressive models for time series and regression analysis for cross-sectional datasets.
Characteristics of Time Series Data in Data Science
Time series data in data science is characterized by observations collected at consistent time intervals, enabling analysis of temporal patterns and trends. This data type exhibits autocorrelation, where current values depend on past observations, requiring specialized models like ARIMA or LSTM for forecasting. Seasonal effects and non-stationarity are common features, demanding techniques such as differencing or seasonal decomposition to achieve accurate predictions.
Features of Cross-Sectional Data in Technology Applications
Cross-sectional data in technology applications captures information from multiple subjects at a single point in time, enabling the analysis of spatial variations and differences across units such as users, devices, or regions. Key features include its ability to identify patterns, correlations, and heterogeneity among entities without temporal dependencies, making it ideal for benchmarking and comparative studies. This data type supports real-time decision-making systems and personalized technology solutions by offering a snapshot of diverse user behaviors or system states.
Use Cases of Time Series Data Analysis
Time series data analysis is essential for forecasting financial markets, tracking climate change trends, and monitoring sensor data in IoT applications. It enables businesses to identify seasonal patterns, detect anomalies, and optimize inventory management by analyzing data points collected at consistent time intervals. Key sectors benefiting from time series analysis include finance, healthcare, energy, and retail, where temporal insights drive decision-making and operational efficiency.
Applications of Cross-Sectional Data in Data Science
Cross-sectional data in data science is primarily used for analyzing and comparing multiple subjects at a single point in time, such as customer demographics, market segmentation, and health surveys. This type of data supports predictive modeling, classification tasks, and feature extraction by capturing variations across different entities without the temporal component. Cross-sectional analysis enhances decision-making in areas like credit scoring, fraud detection, and targeted marketing campaigns by providing a snapshot of diverse observations simultaneously.
Analytical Techniques for Time Series Data
Time series data analysis involves techniques such as autoregressive integrated moving average (ARIMA), exponential smoothing, and seasonal decomposition to capture temporal dependencies and trends. These methods leverage time-ordered observations to forecast future values and identify patterns like seasonality and cyclic behavior. Unlike cross-sectional data analysis, time series focuses on chronological sequences, requiring models that account for autocorrelation and time-based structures.
Methods for Analyzing Cross-Sectional Data
Methods for analyzing cross-sectional data primarily involve regression analysis, including ordinary least squares (OLS) and logistic regression, to identify relationships between variables at a single point in time. Techniques such as factor analysis and cluster analysis help in uncovering underlying patterns and grouping similar observations within cross-sectional datasets. Cross-sectional methods emphasize controlling for confounding variables to improve causal inference and enhance the reliability of statistical findings.
Challenges in Handling Time Series vs Cross-Sectional Data
Handling time series data presents challenges due to temporal dependencies, non-stationarity, and autocorrelation, requiring specialized techniques like differencing and time-based validation. Cross-sectional data, characterized by observations at a single point in time, faces difficulties in capturing causal relationships and controlling for confounding variables. Effective modeling demands tailored approaches to address these distinct statistical properties and ensure accurate prediction and inference.
Choosing the Right Data Type for Your Tech Project
Time series data captures observations sequentially over time, making it ideal for trend analysis, forecasting, and monitoring changes in variables like stock prices or sensor readings. Cross-sectional data provides a snapshot of multiple variables at a single point in time, best suited for comparative studies, classification, and identifying relationships between different entities. Selecting the right data type depends on your project goals--use time series for temporal dynamics and cross-sectional data for analyzing patterns across diverse subjects or groups.
time series vs cross-sectional data Infographic