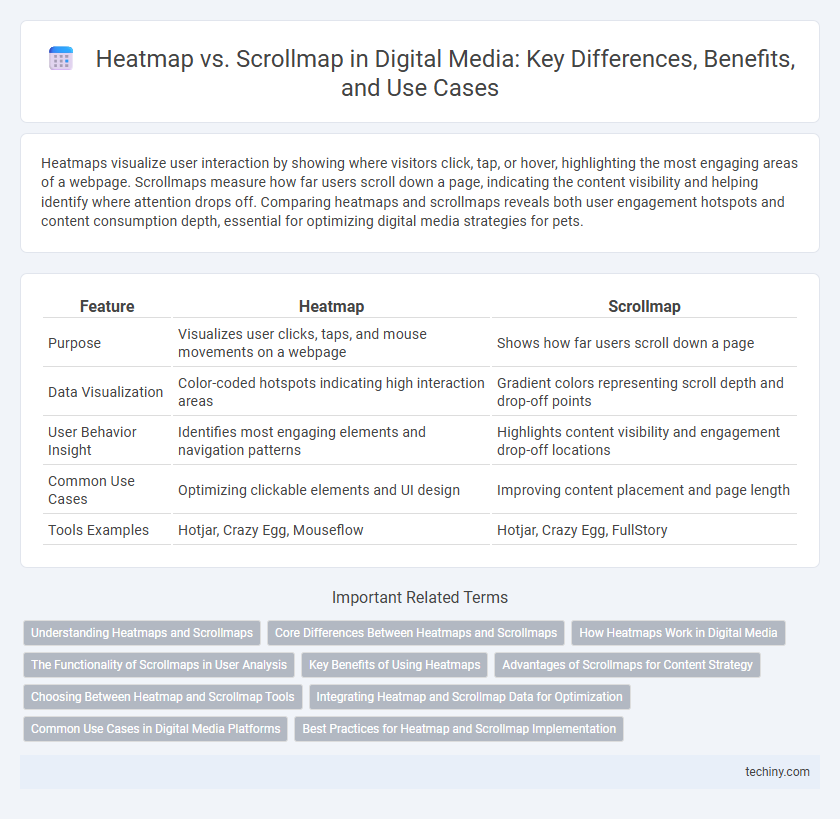
Heatmaps visualize user interaction by showing where visitors click, tap, or hover, highlighting the most engaging areas of a webpage. Scrollmaps measure how far users scroll down a page, indicating the content visibility and helping identify where attention drops off. Comparing heatmaps and scrollmaps reveals both user engagement hotspots and content consumption depth, essential for optimizing digital media strategies for pets.
Table of Comparison
| Feature | Heatmap | Scrollmap |
|---|---|---|
| Purpose | Visualizes user clicks, taps, and mouse movements on a webpage | Shows how far users scroll down a page |
| Data Visualization | Color-coded hotspots indicating high interaction areas | Gradient colors representing scroll depth and drop-off points |
| User Behavior Insight | Identifies most engaging elements and navigation patterns | Highlights content visibility and engagement drop-off locations |
| Common Use Cases | Optimizing clickable elements and UI design | Improving content placement and page length |
| Tools Examples | Hotjar, Crazy Egg, Mouseflow | Hotjar, Crazy Egg, FullStory |
Understanding Heatmaps and Scrollmaps
Heatmaps visually represent user interactions on digital media by displaying areas of high engagement through color gradients, revealing where users click, hover, or focus most intensely. Scrollmaps track the depth of user scrolling on a webpage, highlighting how far visitors progress through content and identifying sections that capture or lose attention. Together, heatmaps and scrollmaps provide comprehensive insights into user behavior, enabling optimization of digital media layouts for enhanced user experience and increased conversion rates.
Core Differences Between Heatmaps and Scrollmaps
Heatmaps visually represent user interactions such as clicks, taps, and mouse movements, highlighting the most engaged areas on a webpage, whereas scrollmaps specifically track how far users scroll down a page, revealing content visibility and engagement depth. Heatmaps provide granular insights into user behavior on static elements, while scrollmaps are essential for understanding content consumption patterns and drop-off points. Both tools complement each other in optimizing digital media strategies by offering distinct but interrelated user engagement metrics.
How Heatmaps Work in Digital Media
Heatmaps in digital media visualize user interactions by using color gradients to represent areas with the highest engagement, such as clicks, taps, or mouse movements. They collect data through tracking scripts embedded in web pages, enabling marketers to identify hotspots and optimize content placement for enhanced user experience. Unlike scrollmaps, heatmaps provide granular insight into specific user actions, guiding precise adjustments in design and layout strategies.
The Functionality of Scrollmaps in User Analysis
Scrollmaps visualize users' scrolling behavior by highlighting the depth and sections of a webpage that receive the most engagement, enabling detailed analysis of content visibility and user attention. Unlike heatmaps that track clicks or mouse movements, scrollmaps specifically measure how far users scroll, providing insights into content placement effectiveness and identifying where users lose interest. This functionality allows digital media professionals to optimize page layouts, improve user experience, and enhance conversion rates based on precise user engagement metrics.
Key Benefits of Using Heatmaps
Heatmaps visually represent user interaction by highlighting areas with the highest engagement, enabling digital media professionals to identify which content captures the most attention. Unlike scrollmaps that track page depth, heatmaps offer precise insights into clicks, taps, and mouse movements, facilitating optimized layout and design decisions. These data-driven insights increase conversion rates and enhance user experience by pinpointing usability issues and content effectiveness.
Advantages of Scrollmaps for Content Strategy
Scrollmaps provide detailed insights into user engagement by visually representing how far visitors scroll down a webpage, allowing content strategists to identify where attention drops off and optimize content placement effectively. They reveal the exact scroll depth reached by users, enabling precise adjustments to ensure critical information and calls-to-action appear within the most viewed areas. Unlike heatmaps, scrollmaps offer a straightforward metric of content visibility, enhancing decision-making in content layout and structure to boost user retention and interaction.
Choosing Between Heatmap and Scrollmap Tools
Heatmap tools visualize aggregated user interactions such as clicks, taps, and mouse movements, highlighting the most engaging areas on a webpage. Scrollmap tools specifically track vertical scrolling behavior, revealing how far users scroll and where they drop off, which is critical for understanding content visibility. Choosing between heatmap and scrollmap tools depends on whether the goal is to analyze precise engagement hotspots or to evaluate content consumption depth for optimizing user experience.
Integrating Heatmap and Scrollmap Data for Optimization
Integrating heatmap and scrollmap data enables a comprehensive analysis of user interaction by combining click intensity with page navigation depth. This fusion provides deeper insights into content engagement patterns, revealing which elements capture attention and how far users explore key sections. Leveraging these combined metrics drives data-informed decisions to optimize layout, enhance user experience, and increase conversion rates effectively.
Common Use Cases in Digital Media Platforms
Heatmaps visually represent user interactions such as clicks, taps, and mouse movements to identify high-engagement areas on digital media platforms. Scrollmaps track how far users scroll down a webpage, highlighting content drop-off points and informing layout adjustments to enhance user retention. Combining heatmaps and scrollmaps enables digital media specialists to optimize content placement and improve overall user experience effectively.
Best Practices for Heatmap and Scrollmap Implementation
Heatmap implementation best practices involve segmenting user interactions by device type and utilizing real-time data to identify high-engagement zones accurately. Scrollmaps require careful calibration of scroll depth thresholds to analyze user content consumption patterns effectively and optimize page layout. Combining both tools with A/B testing enhances insight into user behavior, driving data-informed design improvements in digital media platforms.
Heatmap vs Scrollmap Infographic