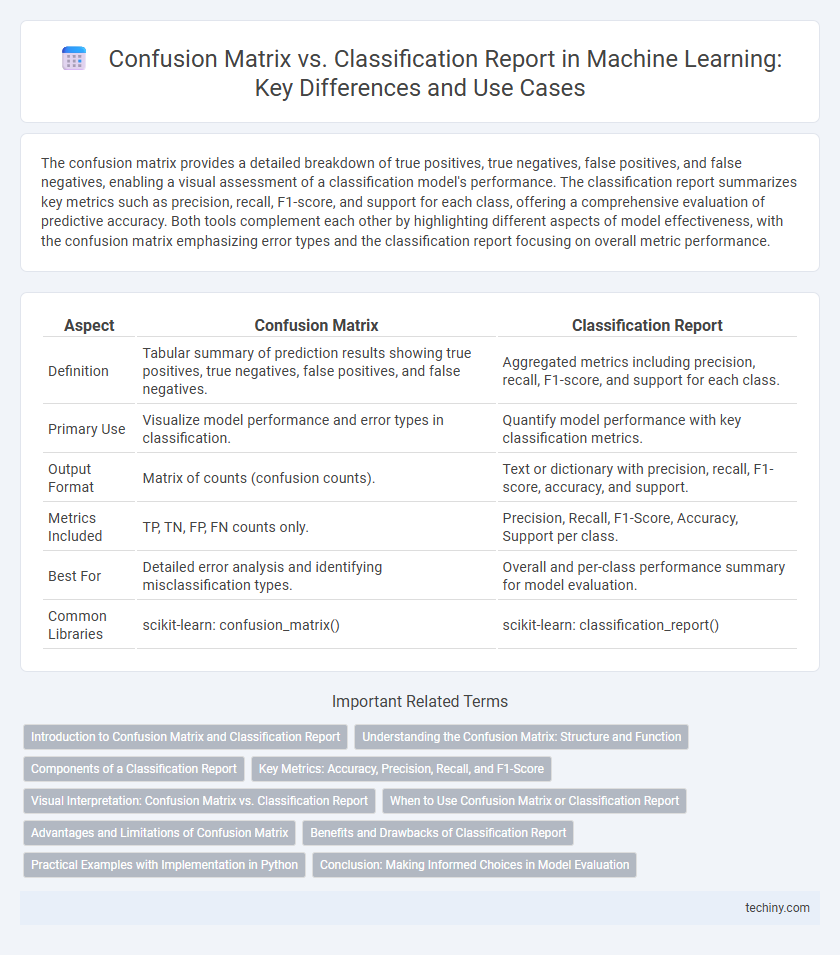
The confusion matrix provides a detailed breakdown of true positives, true negatives, false positives, and false negatives, enabling a visual assessment of a classification model's performance. The classification report summarizes key metrics such as precision, recall, F1-score, and support for each class, offering a comprehensive evaluation of predictive accuracy. Both tools complement each other by highlighting different aspects of model effectiveness, with the confusion matrix emphasizing error types and the classification report focusing on overall metric performance.
Table of Comparison
| Aspect | Confusion Matrix | Classification Report |
|---|---|---|
| Definition | Tabular summary of prediction results showing true positives, true negatives, false positives, and false negatives. | Aggregated metrics including precision, recall, F1-score, and support for each class. |
| Primary Use | Visualize model performance and error types in classification. | Quantify model performance with key classification metrics. |
| Output Format | Matrix of counts (confusion counts). | Text or dictionary with precision, recall, F1-score, accuracy, and support. |
| Metrics Included | TP, TN, FP, FN counts only. | Precision, Recall, F1-Score, Accuracy, Support per class. |
| Best For | Detailed error analysis and identifying misclassification types. | Overall and per-class performance summary for model evaluation. |
| Common Libraries | scikit-learn: confusion_matrix() | scikit-learn: classification_report() |
Introduction to Confusion Matrix and Classification Report
The Confusion Matrix visually represents the performance of a classification algorithm by displaying the counts of true positives, true negatives, false positives, and false negatives. The Classification Report summarizes key performance metrics such as precision, recall, F1-score, and support for each class, providing a detailed evaluation of model accuracy. Both tools are essential in machine learning for interpreting classification results and fine-tuning predictive models.
Understanding the Confusion Matrix: Structure and Function
The confusion matrix is a fundamental tool in machine learning for evaluating classification models by displaying the true positive, true negative, false positive, and false negative counts in a matrix format. This structure enables detailed assessment of model performance across classes, highlighting specific areas of misclassification. Understanding the confusion matrix facilitates the calculation of key metrics such as accuracy, precision, recall, and F1-score, which are essential components of the classification report.
Components of a Classification Report
A Classification Report in machine learning provides detailed evaluation metrics including precision, recall, F1-score, and support for each class, offering a comprehensive performance overview beyond the basic counts in a Confusion Matrix. Precision measures the accuracy of positive predictions, recall indicates the ability to find all positive instances, and the F1-score balances precision and recall for a robust quality metric. Support represents the number of true instances for each class, aiding in understanding class distribution and the impact on model evaluation.
Key Metrics: Accuracy, Precision, Recall, and F1-Score
The confusion matrix provides a detailed breakdown of true positives, true negatives, false positives, and false negatives, crucial for calculating key classification metrics. Accuracy measures the overall correctness, precision evaluates the proportion of true positives among predicted positives, recall assesses the ability to identify actual positives, and the F1-score balances precision and recall in a single metric. These metrics derived from the confusion matrix enable comprehensive performance evaluation of classification models, guiding model improvements in machine learning tasks.
Visual Interpretation: Confusion Matrix vs. Classification Report
The confusion matrix provides a clear visual grid that displays true positives, false positives, true negatives, and false negatives, making it easy to interpret the performance of classification models at a glance. In contrast, the classification report summarizes key metrics such as precision, recall, F1-score, and support in a textual format, which is less visual but more comprehensive for detailed performance analysis. Visual interpretation benefits from the confusion matrix's straightforward layout, aiding in quickly identifying misclassifications and understanding error types across different classes.
When to Use Confusion Matrix or Classification Report
Use a confusion matrix when you need a detailed breakdown of classification outcomes, including true positives, false positives, true negatives, and false negatives for each class. Opt for a classification report to obtain a comprehensive summary of precision, recall, F1-score, and support, which helps evaluate overall model performance across multiple classes. The confusion matrix is ideal for granular error analysis in binary or multiclass problems, whereas the classification report excels in summarizing performance metrics for quick comparisons.
Advantages and Limitations of Confusion Matrix
The confusion matrix offers a clear visual representation of prediction outcomes by displaying true positives, true negatives, false positives, and false negatives, which helps identify specific error types in classification tasks. Its main advantage lies in providing detailed insight into the performance of each class, particularly useful in imbalanced datasets where accuracy alone can be misleading. However, the confusion matrix lacks concise summary metrics such as precision, recall, and F1-score, limiting its use for quick model evaluation compared to the classification report.
Benefits and Drawbacks of Classification Report
The Classification Report provides a detailed summary of key metrics such as precision, recall, F1-score, and support for each class, enabling a comprehensive evaluation of a model's performance across imbalanced datasets. It offers a clear insight into how well the model distinguishes between classes but may be less intuitive than a Confusion Matrix for visualizing actual prediction errors. While the report excels in metric-driven analysis, it lacks the immediate interpretability of error types that a Confusion Matrix visually delivers, which can be critical for diagnosing specific model weaknesses.
Practical Examples with Implementation in Python
Confusion Matrix offers a straightforward visualization of true positives, false positives, true negatives, and false negatives, making it essential for evaluating model performance in binary and multi-class classification tasks. Classification Report extends this analysis by providing precision, recall, F1-score, and support metrics, which quantify the trade-offs between false positives and false negatives across classes. Implementing both in Python using libraries like scikit-learn involves importing metrics such as confusion_matrix and classification_report, training models with datasets like Iris or MNIST, and validating outputs to fine-tune classifiers for optimized predictive accuracy.
Conclusion: Making Informed Choices in Model Evaluation
Confusion Matrix provides a detailed breakdown of classification outcomes, highlighting true positives, false positives, true negatives, and false negatives, which is essential for understanding specific types of errors in a machine learning model. Classification Report summarizes precision, recall, F1-score, and support for each class, offering a comprehensive performance overview that facilitates comparison across models or datasets. Selecting between these tools depends on the evaluation goals: use Confusion Matrix for error analysis and Classification Report for balanced metric assessment in model tuning.
Confusion Matrix vs Classification Report Infographic