Heatmaps visually represent user attention by displaying areas of a webpage where visitors focus their gaze, highlighting patterns of engagement through color gradients. Clickmaps specifically track and illustrate where users have clicked, revealing interactive elements that attract user actions. Combining heatmaps and clickmaps provides a comprehensive analysis of both user interest and behavior, optimizing digital media strategies for enhanced engagement.
Table of Comparison
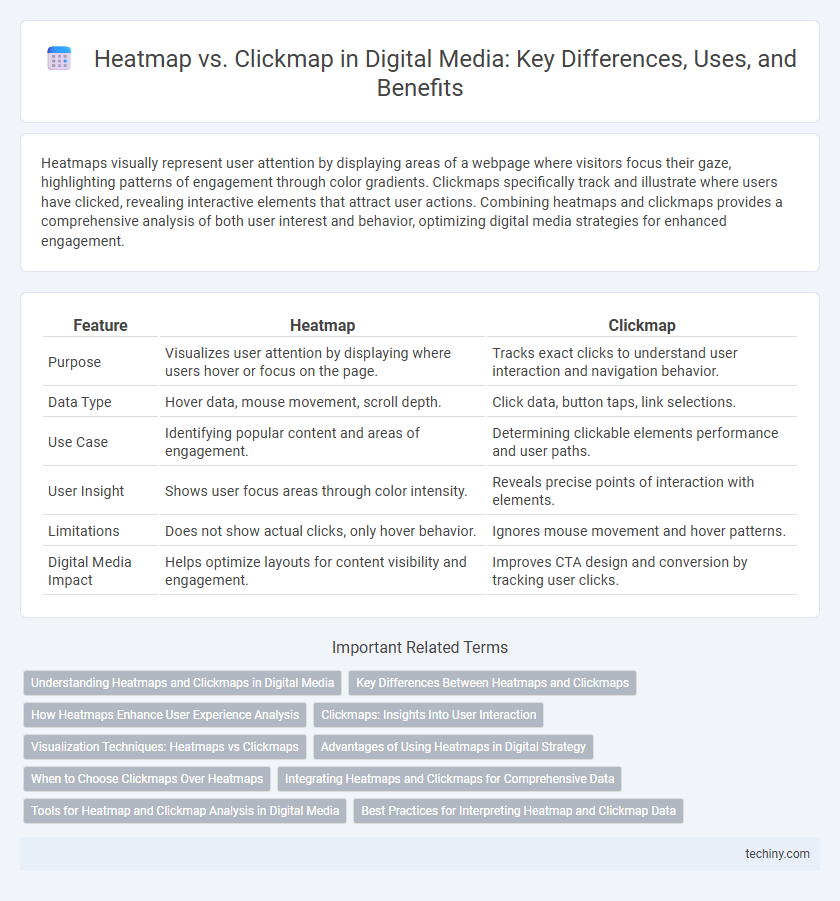
| Feature | Heatmap | Clickmap |
|---|---|---|
| Purpose | Visualizes user attention by displaying where users hover or focus on the page. | Tracks exact clicks to understand user interaction and navigation behavior. |
| Data Type | Hover data, mouse movement, scroll depth. | Click data, button taps, link selections. |
| Use Case | Identifying popular content and areas of engagement. | Determining clickable elements performance and user paths. |
| User Insight | Shows user focus areas through color intensity. | Reveals precise points of interaction with elements. |
| Limitations | Does not show actual clicks, only hover behavior. | Ignores mouse movement and hover patterns. |
| Digital Media Impact | Helps optimize layouts for content visibility and engagement. | Improves CTA design and conversion by tracking user clicks. |
Understanding Heatmaps and Clickmaps in Digital Media
Heatmaps visually represent user interaction intensity on digital media platforms by displaying colors that correlate with engagement levels, highlighting areas with the highest attention. Clickmaps specifically track and visualize users' clicking behavior to identify which elements on a webpage attract the most interaction, providing precise data on navigation and user preferences. Understanding these tools enables digital marketers to optimize content placement, enhance user experience, and improve conversion rates by analyzing visual attention and click patterns.
Key Differences Between Heatmaps and Clickmaps
Heatmaps visualize user engagement by displaying areas of a webpage with varying color intensities based on mouse movement, scroll depth, and time spent, while clickmaps specifically track and highlight the exact spots where users click. Heatmaps provide insights into overall user attention and behavior patterns, whereas clickmaps offer precise data on user interaction points for optimizing link placements and call-to-action buttons. Both tools complement each other in analyzing user experience but differ fundamentally in the type of engagement data they capture and represent.
How Heatmaps Enhance User Experience Analysis
Heatmaps provide a visual representation of user engagement by highlighting areas of high interaction intensity on a webpage, enabling better identification of content that captures attention. Unlike clickmaps, which only track user clicks, heatmaps incorporate cursor movements and scrolling behavior to offer comprehensive insights into user interest and navigation patterns. This data helps designers optimize layout and content positioning, ultimately enhancing user experience by aligning website elements with actual user behavior.
Clickmaps: Insights Into User Interaction
Clickmaps provide detailed insights into user interaction by visually representing where visitors click on a webpage, highlighting the most engaging elements and revealing navigation patterns. This data allows digital media strategists to optimize layout, improve call-to-action placements, and enhance overall user experience by understanding precise click behavior. Unlike heatmaps, which indicate general attention areas through color gradients, clickmaps offer exact click location metrics critical for targeted UX improvements.
Visualization Techniques: Heatmaps vs Clickmaps
Heatmaps use color gradients to display areas of high user engagement by tracking cursor movement and scroll depth, providing an intuitive visual representation of user attention on web pages. Clickmaps specifically record and visualize clicks, showing exact points of interaction to analyze which elements receive the most user responses. Both visualization techniques complement each other by offering comprehensive insights into user behavior, enhancing digital media optimization strategies.
Advantages of Using Heatmaps in Digital Strategy
Heatmaps provide comprehensive visual insights into user behavior by displaying areas of high engagement through color intensity, enabling marketers to identify which sections capture the most attention on a webpage. Unlike clickmaps that only track specific clicks, heatmaps analyze scrolling, mouse movement, and hover patterns, offering a holistic view of user interaction for optimizing page layout and content placement. This data-driven approach enhances user experience design and boosts conversion rates by prioritizing elements that naturally attract visitors' focus.
When to Choose Clickmaps Over Heatmaps
Clickmaps are ideal when precise user interactions, such as button clicks or link activations, need to be tracked on digital media platforms to measure conversion points and user engagement. Unlike heatmaps, which show aggregate attention hotspots, clickmaps provide granular data on user behavior, enabling targeted UI improvements and A/B testing accuracy. Marketers and UX designers should choose clickmaps for detailed click-based analysis to optimize user flow and maximize content effectiveness.
Integrating Heatmaps and Clickmaps for Comprehensive Data
Integrating heatmaps and clickmaps provides a comprehensive analysis of user interaction by combining visual attention data with precise click behavior metrics. Heatmaps reveal areas of high engagement through color gradients, highlighting user focus zones, while clickmaps track exact click locations, offering granular insights into user navigation patterns. Utilizing both tools together enables digital media professionals to optimize content layout, improve user experience, and increase conversion rates based on thorough behavioral data analysis.
Tools for Heatmap and Clickmap Analysis in Digital Media
Heatmap tools such as Hotjar, Crazy Egg, and Microsoft Clarity provide visual overlays that highlight user attention by tracking mouse movement and scrolling behavior in digital media. Clickmap analysis tools like Clicktale and Mouseflow specialize in capturing precise user clicks, enabling marketers to identify high-engagement zones and optimize call-to-action placements. Integrating these heatmap and clickmap tools enhances user experience insights, driving data-driven decisions for website and campaign improvements.
Best Practices for Interpreting Heatmap and Clickmap Data
Heatmaps visualize user attention by displaying aggregated mouse movements and scroll behavior, while clickmaps specifically track click interactions, highlighting hotspots on digital media platforms. Best practices for interpreting heatmap and clickmap data involve correlating heat intensity with user intent, segmenting traffic sources to understand different user behaviors, and cross-referencing with conversion metrics to identify actionable insights for UI/UX optimization. Leveraging combined heatmap and clickmap analytics improves digital content strategy by pinpointing engagement patterns and optimizing interactive elements for increased user interaction.
Heatmap vs Clickmap Infographic