Principal Component Analysis (PCA) reduces dimensionality by projecting data onto orthogonal components based on variance, facilitating interpretability and linear relationships. t-SNE emphasizes preserving local structures by mapping high-dimensional data into a low-dimensional space, excelling in visualizing complex, nonlinear patterns. Choosing between PCA and t-SNE depends on the analysis goal: PCA for global data structure and feature reduction, t-SNE for detailed cluster visualization.
Table of Comparison
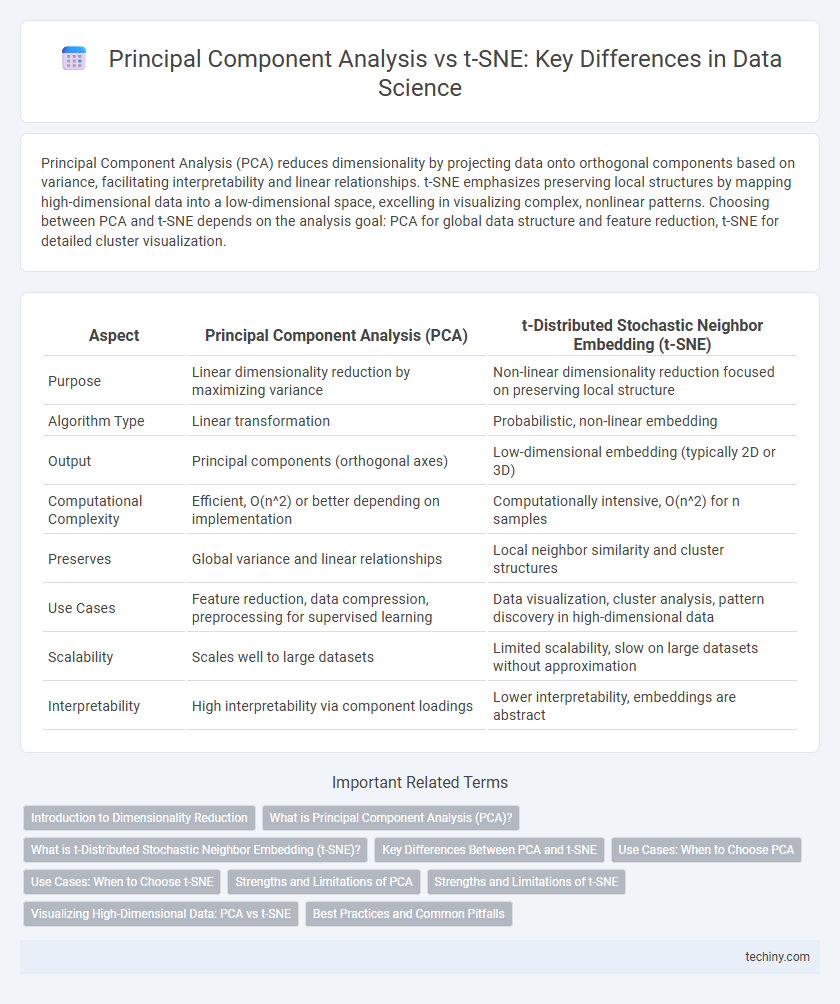
| Aspect | Principal Component Analysis (PCA) | t-Distributed Stochastic Neighbor Embedding (t-SNE) |
|---|---|---|
| Purpose | Linear dimensionality reduction by maximizing variance | Non-linear dimensionality reduction focused on preserving local structure |
| Algorithm Type | Linear transformation | Probabilistic, non-linear embedding |
| Output | Principal components (orthogonal axes) | Low-dimensional embedding (typically 2D or 3D) |
| Computational Complexity | Efficient, O(n^2) or better depending on implementation | Computationally intensive, O(n^2) for n samples |
| Preserves | Global variance and linear relationships | Local neighbor similarity and cluster structures |
| Use Cases | Feature reduction, data compression, preprocessing for supervised learning | Data visualization, cluster analysis, pattern discovery in high-dimensional data |
| Scalability | Scales well to large datasets | Limited scalability, slow on large datasets without approximation |
| Interpretability | High interpretability via component loadings | Lower interpretability, embeddings are abstract |
Introduction to Dimensionality Reduction
Principal Component Analysis (PCA) reduces dimensionality by transforming data into orthogonal components that maximize variance, enabling simpler and faster analysis of high-dimensional datasets. t-Distributed Stochastic Neighbor Embedding (t-SNE) excels at preserving local structures and visualizing complex, non-linear relationships in lower-dimensional spaces, especially for clustering and pattern recognition. Both techniques address the curse of dimensionality but differ in computational complexity, interpretability, and suitability depending on the dataset and analysis goals.
What is Principal Component Analysis (PCA)?
Principal Component Analysis (PCA) is a linear dimensionality reduction technique that transforms high-dimensional data into a lower-dimensional space by identifying the directions, called principal components, that maximize variance. PCA helps to reduce noise and simplify data while preserving as much variability as possible, making it commonly used for feature extraction and visualization in data science. Unlike t-SNE, PCA is computationally efficient and provides a global, interpretable structure of the data variance.
What is t-Distributed Stochastic Neighbor Embedding (t-SNE)?
t-Distributed Stochastic Neighbor Embedding (t-SNE) is a nonlinear dimensionality reduction technique used for visualizing high-dimensional data by modeling each high-dimensional object by a two- or three-dimensional point in such a way that similar objects are modeled by nearby points and dissimilar objects are modeled by distant points. Unlike Principal Component Analysis (PCA), which focuses on maximizing variance captured through linear transformations, t-SNE emphasizes preserving the local structure and relationships among data points by converting similarities into joint probabilities and minimizing the Kullback-Leibler divergence between these probabilities in high and low dimensions. This makes t-SNE particularly effective for visualizing clusters and complex manifolds in datasets such as images, gene expressions, or word embeddings.
Key Differences Between PCA and t-SNE
Principal Component Analysis (PCA) is a linear dimensionality reduction technique that projects data onto orthogonal components maximizing variance and is effective for preserving global structure. t-Distributed Stochastic Neighbor Embedding (t-SNE) is a nonlinear method designed for visualizing high-dimensional data by capturing local neighbor relationships and clusters in lower-dimensional space. While PCA emphasizes variance and computational efficiency, t-SNE excels in uncovering complex, nonlinear patterns but is computationally intensive and less interpretable.
Use Cases: When to Choose PCA
Principal Component Analysis (PCA) excels in reducing dimensionality for large datasets with linear relationships, improving interpretability and computational efficiency. It is ideal when the goal is to preserve global structure and variance, such as in feature extraction, noise reduction, or pre-processing for machine learning models. PCA's deterministic nature and scalability make it preferable over t-SNE for high-dimensional data requiring quick, consistent transformation.
Use Cases: When to Choose t-SNE
t-SNE excels in visualizing high-dimensional data by preserving local structures and revealing complex patterns, making it ideal for exploratory data analysis in tasks such as image recognition, genomics, and natural language processing. Unlike PCA, which is better suited for linear dimensionality reduction and feature extraction, t-SNE is preferred when the goal is to uncover nuanced clusters in non-linear and highly complex datasets. This method is particularly effective for understanding data distributions and relationships in scenarios where interpretability of the transformed components is less critical than the visual separation of groups.
Strengths and Limitations of PCA
Principal Component Analysis (PCA) excels in reducing dimensionality by transforming correlated variables into orthogonal components that capture maximum variance, making it effective for linear data structures and large datasets. Its computational efficiency and ease of interpretation enable quick identification of dominant data patterns, but PCA assumes linearity and can struggle with nonlinear relationships or complex data manifolds. The method's sensitivity to scaling and its reliance on variance as a metric may limit its effectiveness when important information lies in low-variance components.
Strengths and Limitations of t-SNE
t-SNE excels at visualizing high-dimensional data by preserving local structures, making it ideal for identifying clusters and patterns in complex datasets, especially in fields like genomics and image recognition. However, its computational intensity and sensitivity to hyperparameters such as perplexity and learning rate can limit scalability and reproducibility in large datasets. Unlike PCA, which provides linear dimensionality reduction with clear variance explanation, t-SNE's non-linear transformations complicate interpretability and downstream quantitative analysis.
Visualizing High-Dimensional Data: PCA vs t-SNE
Principal Component Analysis (PCA) reduces dimensionality by projecting data onto orthogonal components that maximize variance, making it ideal for linear patterns and preserving global structure. In contrast, t-SNE excels at capturing complex, nonlinear relationships by modeling local similarities, which enhances cluster visualization at the cost of losing global data geometry. Choosing between PCA and t-SNE depends on whether the goal is to understand overarching data structure or to reveal intricate subgroup formations in high-dimensional datasets.
Best Practices and Common Pitfalls
Principal Component Analysis (PCA) excels in linear dimensionality reduction by preserving variance, making it ideal for initial exploratory data analysis and feature extraction, while t-SNE focuses on capturing local data structure and non-linear patterns suited for visualization of high-dimensional data clusters. Common pitfalls include PCA's inability to capture complex non-linear relationships and t-SNE's sensitivity to hyperparameters such as perplexity and learning rate, which can lead to misleading cluster formations if not properly tuned. Best practices recommend applying PCA for noise reduction before t-SNE and carefully validating t-SNE results with domain knowledge or supplementary quantitative metrics to ensure reliable interpretations.
principal component analysis vs t-SNE Infographic