Root Mean Squared Error (RMSE) emphasizes larger errors by squaring the residuals, making it sensitive to outliers in data science models. Mean Absolute Error (MAE) provides an average magnitude of errors without considering their direction, offering a more interpretable metric in cases with uniform error distribution. Choosing between RMSE and MAE depends on the specific use case and whether penalizing larger deviations is critical for model evaluation.
Table of Comparison
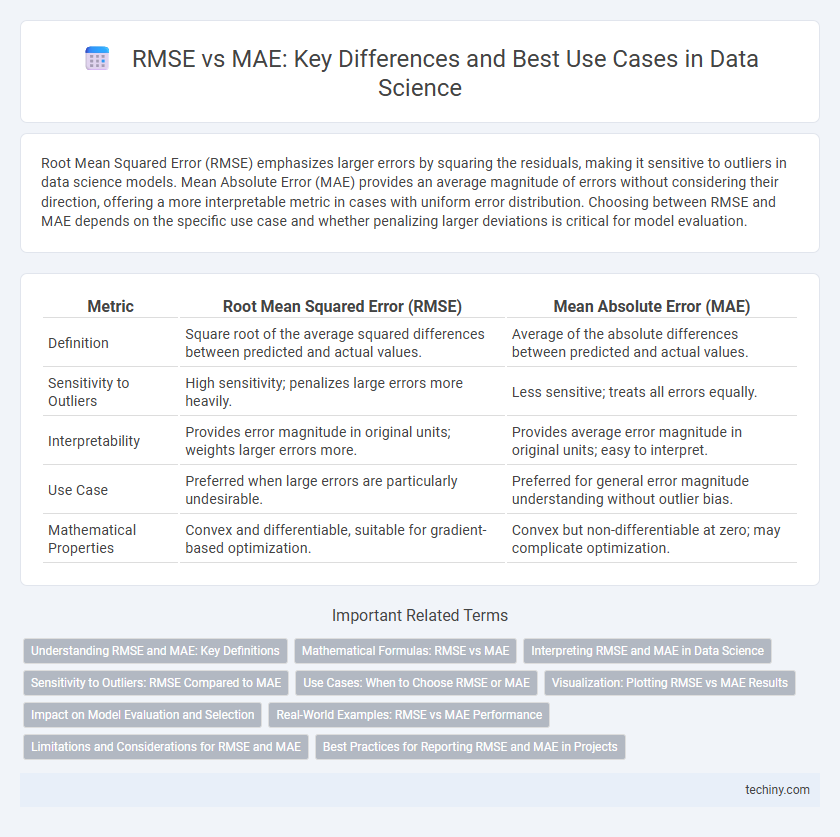
| Metric | Root Mean Squared Error (RMSE) | Mean Absolute Error (MAE) |
|---|---|---|
| Definition | Square root of the average squared differences between predicted and actual values. | Average of the absolute differences between predicted and actual values. |
| Sensitivity to Outliers | High sensitivity; penalizes large errors more heavily. | Less sensitive; treats all errors equally. |
| Interpretability | Provides error magnitude in original units; weights larger errors more. | Provides average error magnitude in original units; easy to interpret. |
| Use Case | Preferred when large errors are particularly undesirable. | Preferred for general error magnitude understanding without outlier bias. |
| Mathematical Properties | Convex and differentiable, suitable for gradient-based optimization. | Convex but non-differentiable at zero; may complicate optimization. |
Understanding RMSE and MAE: Key Definitions
Root Mean Square Error (RMSE) measures the square root of the average squared differences between predicted and observed values, heavily penalizing larger errors due to squaring. Mean Absolute Error (MAE) calculates the average of absolute differences, providing a straightforward measure of error magnitude without emphasizing outliers. Both metrics evaluate prediction accuracy in data science but serve different purposes depending on the sensitivity to large deviations required.
Mathematical Formulas: RMSE vs MAE
Root Mean Squared Error (RMSE) is calculated as the square root of the average of the squared differences between predicted and actual values, formulated as RMSE = sqrt((1/n) * S(y_i - y_i)2). Mean Absolute Error (MAE) represents the average of the absolute differences, mathematically expressed as MAE = (1/n) * S|y_i - y_i|. RMSE penalizes larger errors more heavily due to squaring, while MAE treats all errors linearly, making each metric suitable for different model evaluation contexts.
Interpreting RMSE and MAE in Data Science
Root Mean Squared Error (RMSE) quantifies the average magnitude of prediction errors, emphasizing larger errors due to the squaring process, making it sensitive to outliers in data science models. Mean Absolute Error (MAE) measures average absolute differences between predicted and actual values, offering a more interpretable metric for error magnitude that is less affected by extreme values. Comparing RMSE and MAE assists data scientists in understanding model accuracy and error distribution when evaluating regression performance.
Sensitivity to Outliers: RMSE Compared to MAE
Root Mean Squared Error (RMSE) is highly sensitive to outliers because it squares the residuals, amplifying the impact of large errors. Mean Absolute Error (MAE) treats all errors linearly, making it more robust to outliers by minimizing the influence of extreme deviations. This sensitivity difference makes RMSE preferable when large errors must be heavily penalized, while MAE is better suited for datasets with outliers or non-Gaussian error distributions.
Use Cases: When to Choose RMSE or MAE
RMSE is preferred when larger errors need to be penalized more heavily, making it suitable for applications like finance or engineering where outliers significantly impact model performance. MAE offers a more straightforward interpretation and is ideal for scenarios such as customer satisfaction surveys or basic demand forecasting where all errors are equally important. Choosing between RMSE and MAE depends on the tolerance for large deviations and the specific context of the predictive modeling task.
Visualization: Plotting RMSE vs MAE Results
Visualizing RMSE versus MAE results on a scatter plot enables clear comparison of model error distribution, highlighting differences in sensitivity to outliers where RMSE amplifies larger errors and MAE provides uniform error weighting. Incorporating error bars or confidence intervals around each metric further enhances interpretability by quantifying uncertainty in model performance estimates. Leveraging color gradients or marker size variations to represent additional parameters, such as data subsets or hyperparameter settings, refines insights into model behavior across varying conditions.
Impact on Model Evaluation and Selection
Root Mean Squared Error (RMSE) amplifies the impact of large errors by squaring deviations, making it sensitive to outliers and ideal for penalizing significant prediction errors in model evaluation. Mean Absolute Error (MAE) treats all deviations linearly, providing a more balanced and interpretable metric when the dataset contains noise or outliers. Selecting RMSE or MAE significantly influences model choice, as RMSE prioritizes models minimizing substantial errors while MAE favors models with overall consistent performance across all predictions.
Real-World Examples: RMSE vs MAE Performance
RMSE often outperforms MAE in capturing large errors in real-world data sets like housing price predictions, where penalty for significant deviations is crucial. MAE provides a more interpretable measure of average error, making it preferable in applications such as customer satisfaction scoring with consistent error distribution. In time series forecasting for energy consumption, RMSE highlights occasional spikes, whereas MAE reflects steady accuracy, guiding model choice based on specific business objectives.
Limitations and Considerations for RMSE and MAE
RMSE tends to penalize larger errors more heavily due to squaring the residuals, making it sensitive to outliers, while MAE treats all errors equally, offering robustness in datasets with anomalies. RMSE is differentiable and widely used in optimization algorithms, but its interpretability can be less intuitive compared to MAE's straightforward average error magnitude. Choosing between RMSE and MAE requires consideration of the error distribution and the specific tolerance for outlier effects in the predictive modeling task.
Best Practices for Reporting RMSE and MAE in Projects
When reporting RMSE and MAE in data science projects, always include both metrics to provide a comprehensive evaluation of model performance, as RMSE penalizes larger errors more heavily while MAE offers a linear error measure. Clearly specify the units and data context to ensure interpretability and comparison across models or datasets. Use visualizations such as error distribution plots alongside numeric values to enhance transparency and support decision-making in model assessment.
RMSE vs MAE Infographic