A confusion matrix specifically evaluates the performance of classification models by comparing predicted and actual labels, highlighting true positives, false positives, true negatives, and false negatives. In contrast, a contingency table summarizes the frequency distribution of variables in categorical data without focusing on prediction accuracy. Understanding the distinct purposes of confusion matrices and contingency tables is essential for effective data analysis and interpretation in data science projects.
Table of Comparison
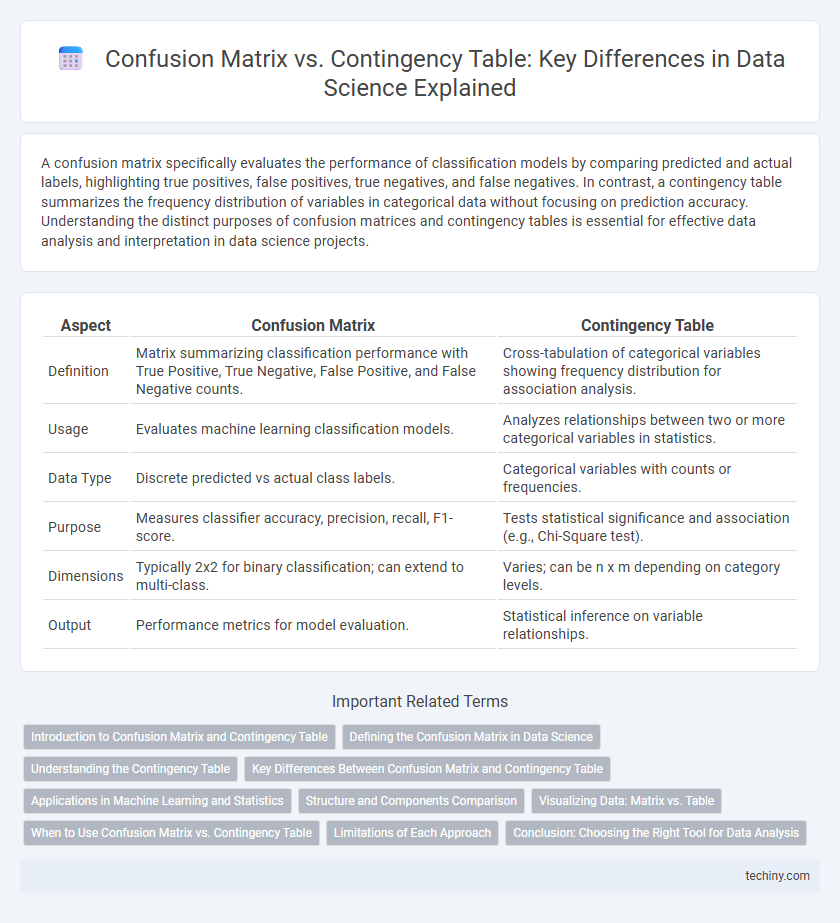
| Aspect | Confusion Matrix | Contingency Table |
|---|---|---|
| Definition | Matrix summarizing classification performance with True Positive, True Negative, False Positive, and False Negative counts. | Cross-tabulation of categorical variables showing frequency distribution for association analysis. |
| Usage | Evaluates machine learning classification models. | Analyzes relationships between two or more categorical variables in statistics. |
| Data Type | Discrete predicted vs actual class labels. | Categorical variables with counts or frequencies. |
| Purpose | Measures classifier accuracy, precision, recall, F1-score. | Tests statistical significance and association (e.g., Chi-Square test). |
| Dimensions | Typically 2x2 for binary classification; can extend to multi-class. | Varies; can be n x m depending on category levels. |
| Output | Performance metrics for model evaluation. | Statistical inference on variable relationships. |
Introduction to Confusion Matrix and Contingency Table
A confusion matrix is a performance measurement tool used in classification problems to visualize the true positives, true negatives, false positives, and false negatives, enabling the evaluation of a model's accuracy and precision. A contingency table, also known as a cross-tabulation or crosstab, summarizes the frequency distribution of variables and is widely used in statistical analysis to examine the relationship between categorical variables. Both tools are essential in data science for interpreting model results and understanding variable associations in datasets.
Defining the Confusion Matrix in Data Science
The confusion matrix is a fundamental tool in data science for evaluating the performance of classification models by displaying the true positives, true negatives, false positives, and false negatives. It provides a detailed breakdown of predicted versus actual class labels, enabling precise calculation of metrics such as accuracy, precision, recall, and F1 score. This matrix is essential for diagnosing model errors and optimizing classification algorithms through informed adjustments.
Understanding the Contingency Table
A contingency table organizes data to display the frequency distribution of variables, essential for examining relationships in categorical data analysis. It helps in visualizing the joint distribution of two or more variables, facilitating the calculation of probabilities, chi-square tests, and other statistical measures. Understanding the contingency table is critical for interpreting patterns and dependencies, serving as the foundational step before delving into specific metrics like those derived from the confusion matrix in classification tasks.
Key Differences Between Confusion Matrix and Contingency Table
A Confusion Matrix is specialized for evaluating the performance of classification models by displaying true positives, true negatives, false positives, and false negatives, whereas a Contingency Table summarizes the relationship between two categorical variables without model-specific context. The Confusion Matrix directly supports metrics like accuracy, precision, recall, and F1-score, essential for machine learning model assessment, while Contingency Tables are used broadly in statistics for hypothesis testing, such as chi-square tests. Confusion Matrices are typically square matrices corresponding to the number of classes in classification, whereas Contingency Tables can vary in size depending on the categories compared.
Applications in Machine Learning and Statistics
The confusion matrix is a specialized contingency table used primarily in machine learning to evaluate classification model performance by comparing predicted and actual labels across true positives, false positives, false negatives, and true negatives. In statistics, contingency tables provide a broader framework to analyze the frequency distribution of categorical variables, enabling tests of independence and association between variables. While both structures organize joint frequency data, confusion matrices focus on model accuracy metrics such as precision, recall, and F1 score, making them integral to supervised learning evaluation.
Structure and Components Comparison
A confusion matrix is a specialized contingency table used primarily in classification problems to display the performance of an algorithm, consisting of true positives, false positives, true negatives, and false negatives. Contingency tables, also known as cross-tabulations, represent the frequency distribution of variables and can handle multiple categories beyond binary classification. Both structures organize data into rows and columns, but confusion matrices specifically quantify prediction results, while contingency tables summarize relationships between categorical variables more broadly.
Visualizing Data: Matrix vs. Table
A confusion matrix visualizes classification model performance by displaying true positives, false positives, true negatives, and false negatives in a structured grid format, enabling quick assessment of prediction accuracy. Contingency tables categorize and summarize the frequency distribution of variables, often used for testing relationships with chi-square statistics. Visualizing data with a confusion matrix highlights model errors and class-specific metrics, whereas contingency tables facilitate understanding of variable associations and dependencies across categories.
When to Use Confusion Matrix vs. Contingency Table
Confusion matrices are primarily used in supervised machine learning for evaluating classification model performance by displaying true positives, false positives, true negatives, and false negatives. Contingency tables are more versatile, suitable for summarizing the relationship between two categorical variables in statistical analysis beyond model evaluation. Use a confusion matrix when assessing predictive accuracy in classification tasks and a contingency table when exploring associations or dependencies between categories in broader data science contexts.
Limitations of Each Approach
Confusion matrices, commonly used in classification tasks, face limitations such as being applicable only to labeled data and binary or multi-class classification problems, lacking the ability to handle continuous or multi-label data effectively. Contingency tables, while useful for summarizing categorical variable relationships, are limited by their dependence on categorical data and inability to provide detailed performance metrics like precision or recall. Both methods may suffer from scalability issues and oversimplification when applied to complex datasets with multiple variables or imbalanced classes.
Conclusion: Choosing the Right Tool for Data Analysis
Confusion matrix and contingency table serve distinct purposes in data analysis; confusion matrix is essential for evaluating classification model performance by displaying true positives, false positives, false negatives, and true negatives. Contingency table, suited for exploring relationships between categorical variables, organizes frequency distributions without model-specific context. Selecting the right tool depends on analysis goals: use confusion matrix for predictive accuracy assessment in supervised learning, and contingency table for examining associations in categorical data.
Confusion Matrix vs Contingency Table Infographic