The mean provides the average value of a dataset by summing all observations and dividing by the count, making it sensitive to extreme outliers. The median identifies the middle value when data points are ordered, offering a robust measure of central tendency in skewed distributions. Choosing between mean and median depends on data symmetry and the presence of outliers for accurate representation.
Table of Comparison
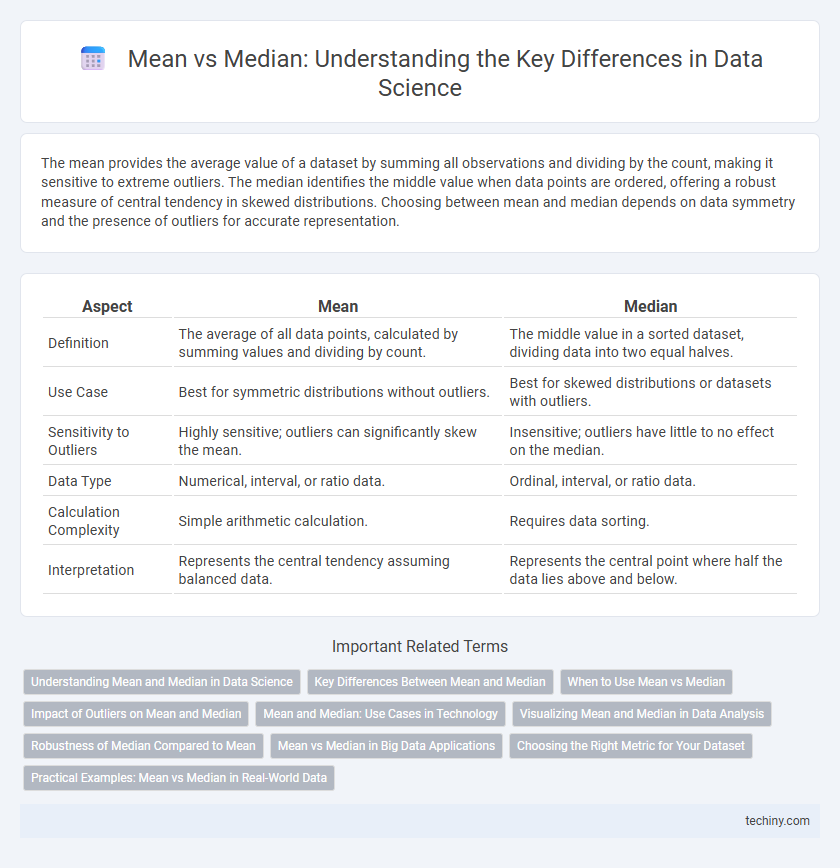
| Aspect | Mean | Median |
|---|---|---|
| Definition | The average of all data points, calculated by summing values and dividing by count. | The middle value in a sorted dataset, dividing data into two equal halves. |
| Use Case | Best for symmetric distributions without outliers. | Best for skewed distributions or datasets with outliers. |
| Sensitivity to Outliers | Highly sensitive; outliers can significantly skew the mean. | Insensitive; outliers have little to no effect on the median. |
| Data Type | Numerical, interval, or ratio data. | Ordinal, interval, or ratio data. |
| Calculation Complexity | Simple arithmetic calculation. | Requires data sorting. |
| Interpretation | Represents the central tendency assuming balanced data. | Represents the central point where half the data lies above and below. |
Understanding Mean and Median in Data Science
Mean and median are fundamental measures of central tendency used in data science to summarize data distributions. The mean provides the arithmetic average, sensitive to all values and outliers, while the median identifies the middle value, offering robustness against skewed data. Understanding the difference between mean and median enables accurate interpretation of datasets, especially when handling non-normal or skewed distributions in statistical analyses and predictive modeling.
Key Differences Between Mean and Median
Mean represents the arithmetic average of a data set, calculated by summing all values and dividing by their count, making it sensitive to extreme values or outliers. Median identifies the middle value when data is ordered, providing a robust measure of central tendency unaffected by skewed distributions. Key differences include mean's vulnerability to outliers and median's suitability for skewed or non-normal data distributions, essential in accurate data analysis and interpretation.
When to Use Mean vs Median
Mean is ideal for normally distributed data without outliers because it accounts for every value, providing a precise measure of central tendency. Median excels in skewed distributions or datasets with extreme outliers, as it represents the middle value and is unaffected by distortions in data. Data scientists select mean for balanced numerical analysis and median for robust insights in asymmetric or noisy data scenarios.
Impact of Outliers on Mean and Median
Outliers significantly affect the mean by pulling it toward extreme values, causing a distortion in the average that may misrepresent the central tendency of the data. The median, being the middle value in an ordered dataset, remains robust and unaffected by outliers, providing a more reliable measure of central tendency in skewed distributions. In data science, leveraging median over mean is essential when dealing with datasets containing outliers to ensure accurate analysis and decision-making.
Mean and Median: Use Cases in Technology
Mean is widely used in technology for average performance metrics such as CPU usage, network latency, and data throughput, where understanding overall trends is crucial. Median proves essential in scenarios with skewed data distributions, like user session durations or transaction amounts, as it provides a more robust measure of central tendency resistant to outliers. Employing mean and median appropriately enhances data-driven decision-making in technology by accurately capturing typical behavior versus central values in noisy datasets.
Visualizing Mean and Median in Data Analysis
Visualizing mean and median in data analysis highlights their roles in summarizing distributions and identifying skewness. Mean provides the arithmetic average sensitive to outliers, while median represents the middle value, offering robustness against skewed data. Plotting both on histograms or box plots reveals central tendency and data symmetry, aiding accurate interpretations.
Robustness of Median Compared to Mean
The median demonstrates superior robustness compared to the mean when analyzing skewed data or datasets with outliers, as it is less influenced by extreme values. In data science, the median provides a more reliable measure of central tendency in distributions with anomalies by focusing on the middle value rather than averaging all points. This makes the median a preferred choice for accurate insights in real-world datasets characterized by heterogeneity and noise.
Mean vs Median in Big Data Applications
Mean and median are critical statistical measures in big data applications, with mean providing an average sensitive to extreme values and median offering a robust central tendency less influenced by outliers. In big data analytics, median is often preferred for skewed datasets or when dealing with noisy, real-world data because it better represents the typical value without distortion from anomalies. Mean remains valuable for normally distributed data and large-scale aggregation tasks where the central limit theorem ensures mean stability and computational efficiency.
Choosing the Right Metric for Your Dataset
Selecting the right central tendency metric depends on the data distribution and presence of outliers. Mean provides accurate insights for symmetric, normally distributed data, while median is more robust against skewed data and extreme values. Understanding these characteristics ensures more reliable analysis and decision-making in data science projects.
Practical Examples: Mean vs Median in Real-World Data
In real-world data, mean and median offer distinct insights depending on data distribution and outliers. For example, in income data, the mean can be skewed by extremely high earners, while the median provides a more accurate representation of typical earnings. In contrast, for symmetrical data like exam scores, mean and median values often align, making both metrics useful for central tendency analysis.
Mean vs Median Infographic