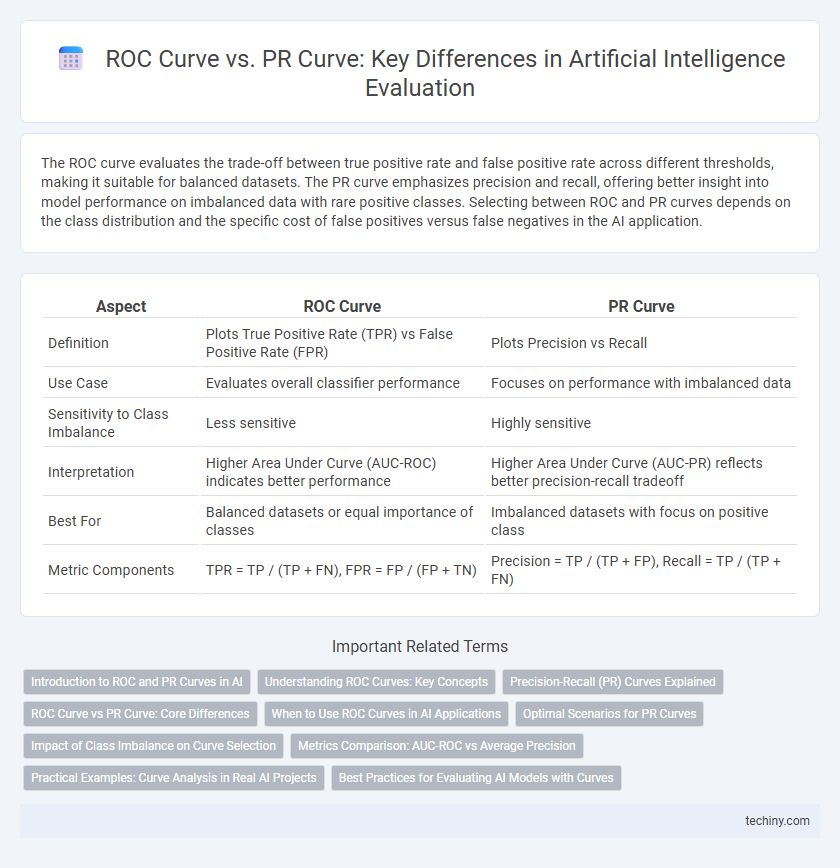
The ROC curve evaluates the trade-off between true positive rate and false positive rate across different thresholds, making it suitable for balanced datasets. The PR curve emphasizes precision and recall, offering better insight into model performance on imbalanced data with rare positive classes. Selecting between ROC and PR curves depends on the class distribution and the specific cost of false positives versus false negatives in the AI application.
Table of Comparison
| Aspect | ROC Curve | PR Curve |
|---|---|---|
| Definition | Plots True Positive Rate (TPR) vs False Positive Rate (FPR) | Plots Precision vs Recall |
| Use Case | Evaluates overall classifier performance | Focuses on performance with imbalanced data |
| Sensitivity to Class Imbalance | Less sensitive | Highly sensitive |
| Interpretation | Higher Area Under Curve (AUC-ROC) indicates better performance | Higher Area Under Curve (AUC-PR) reflects better precision-recall tradeoff |
| Best For | Balanced datasets or equal importance of classes | Imbalanced datasets with focus on positive class |
| Metric Components | TPR = TP / (TP + FN), FPR = FP / (FP + TN) | Precision = TP / (TP + FP), Recall = TP / (TP + FN) |
Introduction to ROC and PR Curves in AI
ROC Curve and PR Curve are essential evaluation metrics used in artificial intelligence to assess the performance of classification models. The ROC Curve plots the true positive rate (sensitivity) against the false positive rate, providing insights into model discrimination across various threshold settings, especially useful for balanced datasets. PR Curve focuses on precision versus recall, offering a more informative view in imbalanced datasets by highlighting the trade-off between false positives and false negatives.
Understanding ROC Curves: Key Concepts
ROC curves plot the true positive rate against the false positive rate, providing a comprehensive view of a classifier's performance across various threshold settings. They are especially useful for evaluating models on balanced datasets by illustrating the trade-offs between sensitivity and specificity. Key metrics derived from ROC curves include the Area Under the Curve (AUC), which quantifies the overall ability of the model to distinguish between classes.
Precision-Recall (PR) Curves Explained
Precision-Recall (PR) curves are critical for evaluating the performance of binary classifiers, especially in imbalanced datasets where the positive class is rare. Unlike ROC curves, PR curves emphasize the trade-off between precision (positive predictive value) and recall (sensitivity), providing more insightful visualization for model effectiveness on minority classes. The area under the PR curve (AUPRC) serves as a robust metric to assess classifier accuracy, highlighting true positive rates and minimizing false positives in applications like fraud detection and medical diagnosis.
ROC Curve vs PR Curve: Core Differences
ROC Curve evaluates a binary classifier's performance by plotting the True Positive Rate against the False Positive Rate, making it effective for balanced datasets. PR Curve emphasizes Precision versus Recall, which is crucial for imbalanced datasets where the positive class is rare. Core differences include ROC Curve's sensitivity to class distribution and PR Curve's focus on positive predictive value, guiding the choice based on dataset characteristics.
When to Use ROC Curves in AI Applications
ROC curves are most effective in AI applications when dealing with balanced datasets where false positive and false negative rates hold equal importance. They provide a comprehensive measure of a model's ability to distinguish between classes by plotting true positive rate against false positive rate across thresholds. ROC curves help evaluate overall classifier performance, especially in scenarios with roughly equal class distributions.
Optimal Scenarios for PR Curves
PR curves are optimal in highly imbalanced datasets where the positive class is rare, emphasizing the model's ability to identify true positives without being misled by a large number of true negatives. Precision-recall curves provide more informative insights when the cost of false positives is high or when the dataset has strong class imbalance, reflecting the trade-off between precision and recall effectively. These curves are particularly useful in applications such as medical diagnosis, fraud detection, and rare event prediction where positive detection accuracy is critical.
Impact of Class Imbalance on Curve Selection
The choice between ROC and PR curves significantly impacts the evaluation of models trained on imbalanced datasets in artificial intelligence. ROC curves can present an overly optimistic view when the negative class dominates, as true negative rates inflate the metric's apparent performance. PR curves focus on precision and recall, providing a more informative assessment by highlighting performance on the minority positive class, which is critical in imbalanced classification problems.
Metrics Comparison: AUC-ROC vs Average Precision
AUC-ROC measures the model's ability to distinguish between classes by evaluating true positive rate against false positive rate across thresholds, making it effective for balanced datasets. Average Precision, derived from the Precision-Recall curve, emphasizes performance on the positive class and is more informative for imbalanced datasets where the minority class is more critical. In imbalanced classification problems, Average Precision often provides a more realistic evaluation of model performance compared to AUC-ROC.
Practical Examples: Curve Analysis in Real AI Projects
In practical AI projects, ROC Curve analysis excels in evaluating model performance on balanced datasets by illustrating the trade-off between true positive rate and false positive rate. PR Curve becomes crucial in imbalanced scenarios, emphasizing precision and recall, which better reflect the performance on rare event detection such as fraud or disease diagnosis. Selecting the appropriate curve for analysis ensures accurate assessment of model capabilities and drives targeted improvements.
Best Practices for Evaluating AI Models with Curves
ROC Curve and PR Curve serve distinct roles in evaluating AI models; ROC Curve excels at visualizing performance over all classification thresholds, especially in balanced datasets, by plotting True Positive Rate against False Positive Rate. PR Curve offers greater insight for imbalanced datasets by focusing on Precision and Recall, highlighting the trade-off between false positives and false negatives relevant for rare event detection. Best practices involve selecting ROC Curve for overall model discrimination assessment and PR Curve for performance evaluation in scenarios with significant class imbalance, ensuring metrics align with specific model objectives.
ROC Curve vs PR Curve Infographic