The Precision-Recall curve offers a more informative evaluation for imbalanced datasets by highlighting the trade-off between precision and recall. The ROC curve plots true positive rate against false positive rate, providing an overall performance measure but can be misleading when classes are highly imbalanced. Precision-Recall curves emphasize relevant positive predictions, making them essential for tasks requiring high accuracy in identifying the minority class.
Table of Comparison
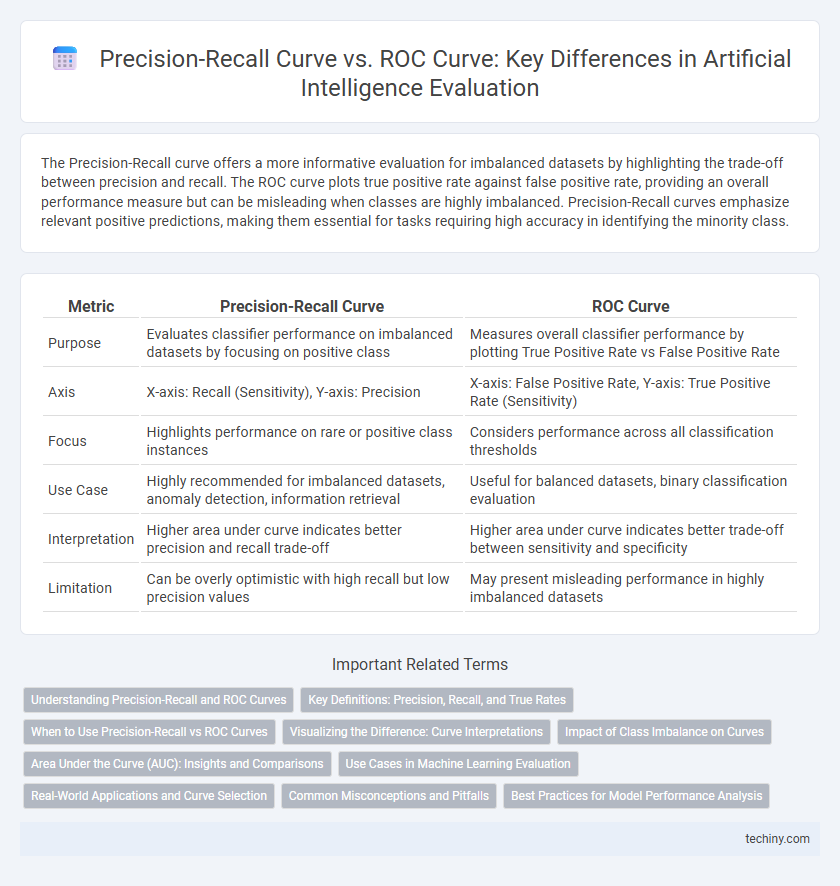
| Metric | Precision-Recall Curve | ROC Curve |
|---|---|---|
| Purpose | Evaluates classifier performance on imbalanced datasets by focusing on positive class | Measures overall classifier performance by plotting True Positive Rate vs False Positive Rate |
| Axis | X-axis: Recall (Sensitivity), Y-axis: Precision | X-axis: False Positive Rate, Y-axis: True Positive Rate (Sensitivity) |
| Focus | Highlights performance on rare or positive class instances | Considers performance across all classification thresholds |
| Use Case | Highly recommended for imbalanced datasets, anomaly detection, information retrieval | Useful for balanced datasets, binary classification evaluation |
| Interpretation | Higher area under curve indicates better precision and recall trade-off | Higher area under curve indicates better trade-off between sensitivity and specificity |
| Limitation | Can be overly optimistic with high recall but low precision values | May present misleading performance in highly imbalanced datasets |
Understanding Precision-Recall and ROC Curves
Precision-Recall curves emphasize the balance between precision and recall, specifically valuable in datasets with class imbalance by highlighting the model's performance on the positive class. ROC curves plot the true positive rate against the false positive rate, offering insight into model discrimination ability across various thresholds. Understanding both curves enables more informed evaluation of classification algorithms, especially in scenarios where positive class detection is critical.
Key Definitions: Precision, Recall, and True Rates
Precision measures the proportion of true positive predictions among all positive predictions, reflecting accuracy in identifying relevant instances. Recall quantifies the ability to detect all actual positive cases, emphasizing completeness. The ROC curve plots the true positive rate against the false positive rate, visualizing the trade-off between sensitivity and specificity, while the Precision-Recall curve highlights the balance between precision and recall, especially useful in imbalanced datasets.
When to Use Precision-Recall vs ROC Curves
Precision-Recall curves are ideal for evaluating models on imbalanced datasets where the positive class is rare, as they emphasize the trade-off between precision and recall, reflecting the model's ability to identify relevant instances. ROC curves are better suited for balanced datasets since they illustrate the true positive rate against the false positive rate, providing an overall sense of the model's discriminative power. Choosing between these curves depends on the problem's class distribution and the cost of false positives versus false negatives.
Visualizing the Difference: Curve Interpretations
The Precision-Recall curve emphasizes the trade-off between precision and recall, making it especially valuable for imbalanced datasets where positive class detection is crucial. In contrast, the ROC curve illustrates the relationship between true positive rate and false positive rate, offering a holistic view of classifier performance across all thresholds. Visual interpretation reveals that Precision-Recall curves highlight performance on minority classes, while ROC curves provide insights into overall discrimination ability.
Impact of Class Imbalance on Curves
The Precision-Recall curve provides a more informative evaluation than the ROC curve in scenarios with significant class imbalance because it focuses on the positive class performance, highlighting the trade-off between precision and recall. ROC curves can present an overly optimistic view in imbalanced datasets since the false positive rate may remain low due to the dominance of the negative class. Therefore, Precision-Recall curves are preferred in applications like rare disease detection or fraud identification, where the positive class is underrepresented.
Area Under the Curve (AUC): Insights and Comparisons
The Area Under the Curve (AUC) for Precision-Recall (PR) and Receiver Operating Characteristic (ROC) curves serve as crucial metrics in evaluating classification model performance, particularly for imbalanced datasets. PR AUC emphasizes the trade-off between precision and recall, offering more informative insights where positive classes are rare, while ROC AUC reflects the balance between true positive and false positive rates across thresholds. In scenarios with high class imbalance, PR AUC often provides a more sensitive evaluation compared to ROC AUC, which can present an overly optimistic view due to the abundance of true negatives.
Use Cases in Machine Learning Evaluation
Precision-Recall Curve excels in evaluating imbalanced datasets where the positive class is rare, such as fraud detection or medical diagnosis, by highlighting the trade-off between precision and recall. ROC Curve provides a broader view of model performance across different classification thresholds, making it suitable for balanced datasets like spam detection or credit scoring. Machine learning practitioners leverage Precision-Recall in scenarios prioritizing the correct identification of positive cases, while ROC Curve aids in understanding overall discrimination ability across classes.
Real-World Applications and Curve Selection
Precision-Recall curves excel in evaluating models on imbalanced datasets common in fraud detection and medical diagnosis, highlighting trade-offs between true positives and false positives more effectively than ROC curves. ROC curves remain valuable for balanced datasets, providing insight into the overall trade-off between sensitivity and specificity across thresholds. Selecting the appropriate curve depends on the specific application goals, such as prioritizing the detection of rare events or maintaining a balanced error ratio.
Common Misconceptions and Pitfalls
The Precision-Recall Curve is more informative than the ROC Curve when evaluating models on imbalanced datasets since it focuses on the positive class performance, preventing misleadingly high scores caused by abundant negative samples. Misinterpreting ROC curves in such contexts can lead to overestimating model efficacy because true negatives dominate, obscuring poor precision or recall. Common pitfalls include ignoring class distribution and relying solely on ROC AUC, which may hide critical trade-offs between precision and recall essential for tasks like fraud detection or medical diagnosis.
Best Practices for Model Performance Analysis
The Precision-Recall curve is most effective for evaluating models on imbalanced datasets, emphasizing the trade-off between true positive rate and the precision of positive predictions. The ROC curve provides an overall measure of model discrimination by plotting true positive rate against false positive rate but may be misleading in skewed class distributions. Best practices recommend using Precision-Recall analysis for rare event detection and ROC analysis for balanced datasets to ensure accurate model performance assessment.
Precision-Recall Curve vs ROC Curve Infographic