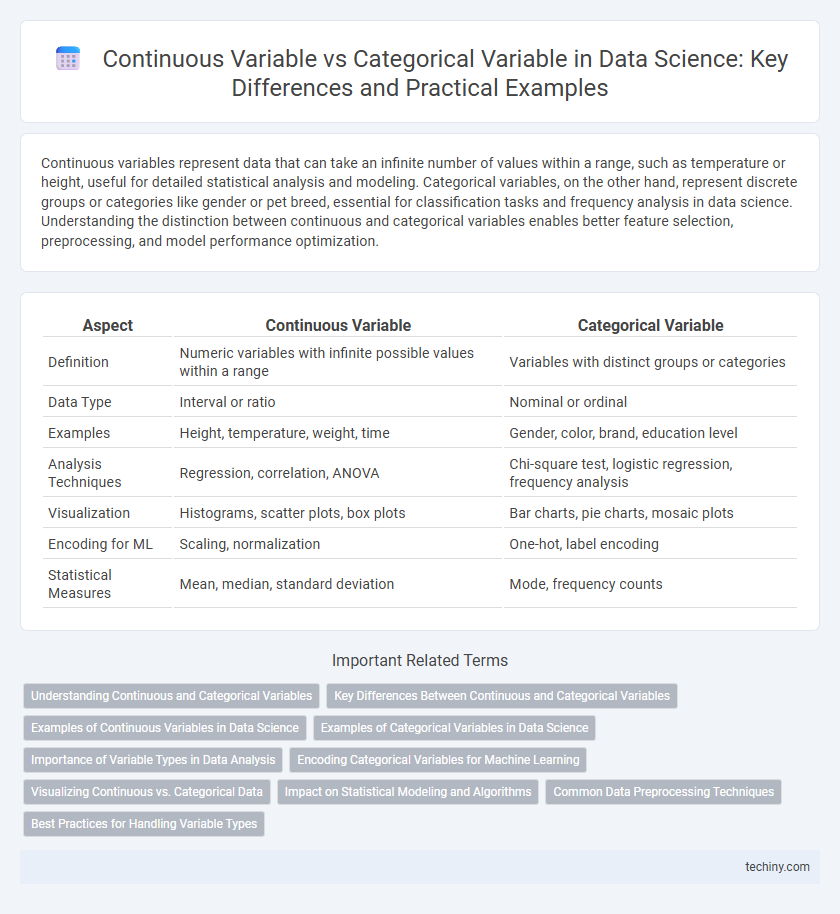
Continuous variables represent data that can take an infinite number of values within a range, such as temperature or height, useful for detailed statistical analysis and modeling. Categorical variables, on the other hand, represent discrete groups or categories like gender or pet breed, essential for classification tasks and frequency analysis in data science. Understanding the distinction between continuous and categorical variables enables better feature selection, preprocessing, and model performance optimization.
Table of Comparison
| Aspect | Continuous Variable | Categorical Variable |
|---|---|---|
| Definition | Numeric variables with infinite possible values within a range | Variables with distinct groups or categories |
| Data Type | Interval or ratio | Nominal or ordinal |
| Examples | Height, temperature, weight, time | Gender, color, brand, education level |
| Analysis Techniques | Regression, correlation, ANOVA | Chi-square test, logistic regression, frequency analysis |
| Visualization | Histograms, scatter plots, box plots | Bar charts, pie charts, mosaic plots |
| Encoding for ML | Scaling, normalization | One-hot, label encoding |
| Statistical Measures | Mean, median, standard deviation | Mode, frequency counts |
Understanding Continuous and Categorical Variables
Continuous variables represent measurable quantities that can take any value within a range, such as height, temperature, or age, enabling precise and granular analysis in data science. Categorical variables denote distinct groups or categories, like gender, color, or brand, and are essential for classification and segmentation tasks. Understanding the differences between continuous and categorical variables guides appropriate statistical techniques and model selection, improving data interpretation and predictive accuracy.
Key Differences Between Continuous and Categorical Variables
Continuous variables represent numeric data that can take any value within a range, such as height or temperature, enabling precise measurements and statistical analysis like mean and standard deviation. Categorical variables classify data into distinct groups or categories, such as gender or color, often used for frequency counts and chi-square tests. Understanding these key differences is crucial for selecting appropriate data visualization and statistical modeling techniques in data science projects.
Examples of Continuous Variables in Data Science
Continuous variables in data science represent measurable quantities that can take any value within a given range, such as temperature in degrees Celsius, height in centimeters, or time in seconds. Examples include stock prices fluctuating throughout the trading day, sensor readings capturing environmental conditions, and customer ages in demographic datasets. These variables enable nuanced statistical analyses, such as regression modeling and hypothesis testing, critical for predictive analytics and machine learning.
Examples of Categorical Variables in Data Science
Categorical variables in data science represent data that can be divided into specific groups or categories, such as gender, color, or country of origin. Examples include customer segments like "new," "returning," or "loyal," product types such as "electronics," "clothing," or "furniture," and survey responses like "agree," "neutral," or "disagree." These variables are crucial for classification tasks, enabling algorithms to identify patterns based on discrete, non-numeric data points.
Importance of Variable Types in Data Analysis
Understanding the distinction between continuous and categorical variables is crucial in data science for selecting appropriate analytical methods and ensuring accurate model predictions. Continuous variables, such as temperature or income, represent measurable quantities with infinite possible values, enabling regression analysis and detailed statistical summaries. Categorical variables, including gender or brand preference, classify data into discrete groups, guiding the use of classification algorithms and chi-square tests to uncover meaningful patterns and relationships within datasets.
Encoding Categorical Variables for Machine Learning
Encoding categorical variables for machine learning involves transforming qualitative data into numerical formats that algorithms can process effectively. Techniques such as one-hot encoding, label encoding, and target encoding are commonly used to convert nominal and ordinal categorical variables into continuous or discrete numeric representations. Proper encoding preserves the inherent relationship and distribution within categorical data, enhancing model accuracy and interpretability in predictive analytics.
Visualizing Continuous vs. Categorical Data
Visualizing continuous data often involves histograms, scatter plots, and box plots to reveal distribution, trends, and outliers, while categorical data is best represented through bar charts, pie charts, and frequency tables to display distinct group frequencies. Effective visualization of continuous variables highlights range and density, whereas for categorical variables, it emphasizes class proportions and mode. Selecting the right visualization depends on the data type to ensure clear insights and accurate interpretation in data science projects.
Impact on Statistical Modeling and Algorithms
Continuous variables enable statistical models to capture nuanced relationships through regression techniques and support algorithms like linear regression and neural networks that rely on metric data. Categorical variables influence model choice by requiring encoding methods such as one-hot or label encoding, impacting algorithms like decision trees and random forests that can directly handle discrete inputs. Understanding variable types is crucial for selecting appropriate feature engineering strategies and optimizing model accuracy in data science projects.
Common Data Preprocessing Techniques
Common data preprocessing techniques for continuous variables include normalization and standardization to ensure data scaling and improve model performance, while categorical variables often require encoding methods such as one-hot encoding or label encoding to convert categories into numerical values. Handling missing data varies by variable type; continuous variables may use mean or median imputation, whereas categorical variables often use mode imputation or a special category for missing values. Feature engineering strategies like binning transform continuous variables into categorical intervals, enhancing model interpretability and robustness in data science workflows.
Best Practices for Handling Variable Types
Best practices for handling variable types in data science emphasize correctly identifying continuous and categorical variables to ensure appropriate analysis methods. Continuous variables require techniques like normalization or scaling, while categorical variables benefit from encoding methods such as one-hot or label encoding to transform data into machine-readable formats. Proper variable handling enhances model accuracy, reduces bias, and improves interpretability in predictive analytics and statistical modeling.
continuous variable vs categorical variable Infographic