KPIs (Key Performance Indicators) are strategic metrics that measure the success of specific business objectives, guiding decision-making processes in data science projects. Metrics provide broader, quantifiable data points that track performance and trends but may not directly indicate overall goal achievement. Distinguishing KPIs from general metrics ensures focused analysis and efficient resource allocation in data-driven environments.
Table of Comparison
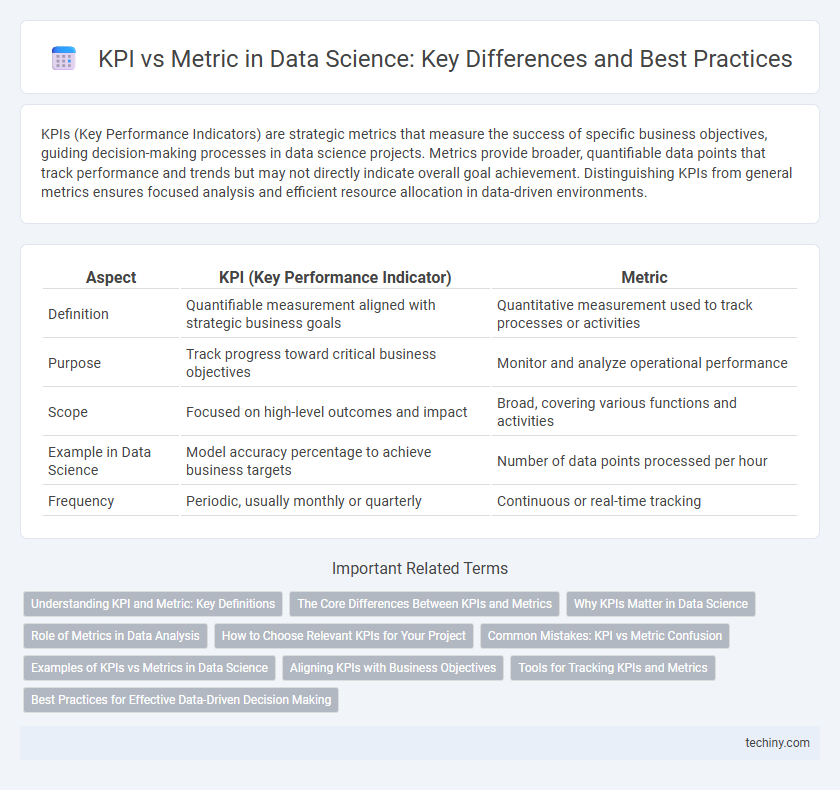
| Aspect | KPI (Key Performance Indicator) | Metric |
|---|---|---|
| Definition | Quantifiable measurement aligned with strategic business goals | Quantitative measurement used to track processes or activities |
| Purpose | Track progress toward critical business objectives | Monitor and analyze operational performance |
| Scope | Focused on high-level outcomes and impact | Broad, covering various functions and activities |
| Example in Data Science | Model accuracy percentage to achieve business targets | Number of data points processed per hour |
| Frequency | Periodic, usually monthly or quarterly | Continuous or real-time tracking |
Understanding KPI and Metric: Key Definitions
KPIs (Key Performance Indicators) are strategic, quantifiable measures used to evaluate the success of specific business objectives, while metrics are broader data points that track performance but may not directly align with strategic goals. KPIs focus on critical outcomes that drive organizational growth, such as customer acquisition rate, revenue growth, or churn rate, providing actionable insights for decision-making. Metrics can include any data measurement, like website traffic or system uptime, serving as components that feed into KPIs or support operational monitoring within data science frameworks.
The Core Differences Between KPIs and Metrics
KPIs (Key Performance Indicators) represent strategic objectives directly tied to business goals, whereas metrics are quantifiable measures used to track specific processes or activities. KPIs have a clear impact on decision-making, guiding performance improvement, while metrics provide granular data that supports analysis but do not inherently indicate success or failure. Understanding the distinction ensures accurate performance evaluation and effective data-driven strategies in data science projects.
Why KPIs Matter in Data Science
Key Performance Indicators (KPIs) in data science provide measurable values that demonstrate how effectively projects achieve critical business objectives, enabling teams to prioritize efforts and allocate resources efficiently. Unlike general metrics, KPIs are strategically selected to reflect the organization's goals, ensuring that data-driven decisions directly impact performance and growth. Tracking KPIs helps data scientists translate complex analyses into actionable insights, aligning technical outcomes with business success.
Role of Metrics in Data Analysis
Metrics quantify specific data points that track performance, while KPIs focus on strategic objectives to measure success. In data analysis, metrics serve as fundamental units of measurement that provide detailed insights, enabling precise evaluation of processes and outcomes. Effective use of metrics supports data-driven decision-making by highlighting trends, anomalies, and areas for improvement within datasets.
How to Choose Relevant KPIs for Your Project
Choosing relevant KPIs for your data science project involves identifying metrics that directly align with your business objectives and impact decision-making. Prioritize KPIs that provide actionable insights, measurable outcomes, and clear benchmarks for success, such as customer retention rate or model accuracy. Avoid tracking excessive metrics; focus on those that drive progress and reflect project goals accurately.
Common Mistakes: KPI vs Metric Confusion
Confusing KPIs with metrics is a common mistake that can undermine data-driven decision-making in data science. KPIs are strategic indicators tied directly to business goals, while metrics are broader measurements that track various aspects of performance without necessarily linking to objectives. Misinterpreting metrics as KPIs leads to focusing on irrelevant data, hindering the ability to measure true success and optimize processes effectively.
Examples of KPIs vs Metrics in Data Science
In data science, KPIs often include customer lifetime value (CLV), churn rate, and model accuracy, as they directly measure business objectives and outcomes. Metrics such as data latency, the number of features used in a model, or dataset size provide important technical details but do not by themselves indicate progress toward strategic goals. Effective data science projects track KPIs to assess impact on business performance while using metrics to optimize underlying processes and algorithms.
Aligning KPIs with Business Objectives
KPIs (Key Performance Indicators) must directly reflect core business objectives to effectively measure progress and drive strategic decisions. While metrics track various data points, KPIs prioritize the most critical indicators that align with overarching organizational goals, ensuring focused analysis and resource allocation. Aligning KPIs with business objectives enhances data-driven decision-making and promotes measurable growth across departments.
Tools for Tracking KPIs and Metrics
Effective tools for tracking KPIs and metrics in data science include platforms like Tableau, Power BI, and Google Data Studio, which offer robust visualization and real-time data monitoring capabilities. These tools enable data scientists to create customizable dashboards, track performance indicators accurately, and facilitate data-driven decision-making. Integration with data sources such as SQL databases and cloud services ensures seamless and automated data updates for continuous KPI and metric evaluation.
Best Practices for Effective Data-Driven Decision Making
KPIs (Key Performance Indicators) are strategic metrics aligned with organizational goals, while metrics measure specific data points without strategic context. Best practices for effective data-driven decision making include selecting KPIs that directly reflect business objectives, ensuring data accuracy through rigorous validation, and continuously monitoring performance to enable timely adjustments. Leveraging predictive analytics and visualization tools further enhances the interpretation and communication of KPIs and metrics for actionable insights.
KPI vs metric Infographic