The p-value measures the probability of obtaining results at least as extreme as the observed data under the null hypothesis, indicating statistical significance. Confidence intervals provide a range of values within which the true population parameter is expected to fall, offering insight into estimate precision. Using both p-values and confidence intervals enhances data interpretation by balancing significance with effect size reliability.
Table of Comparison
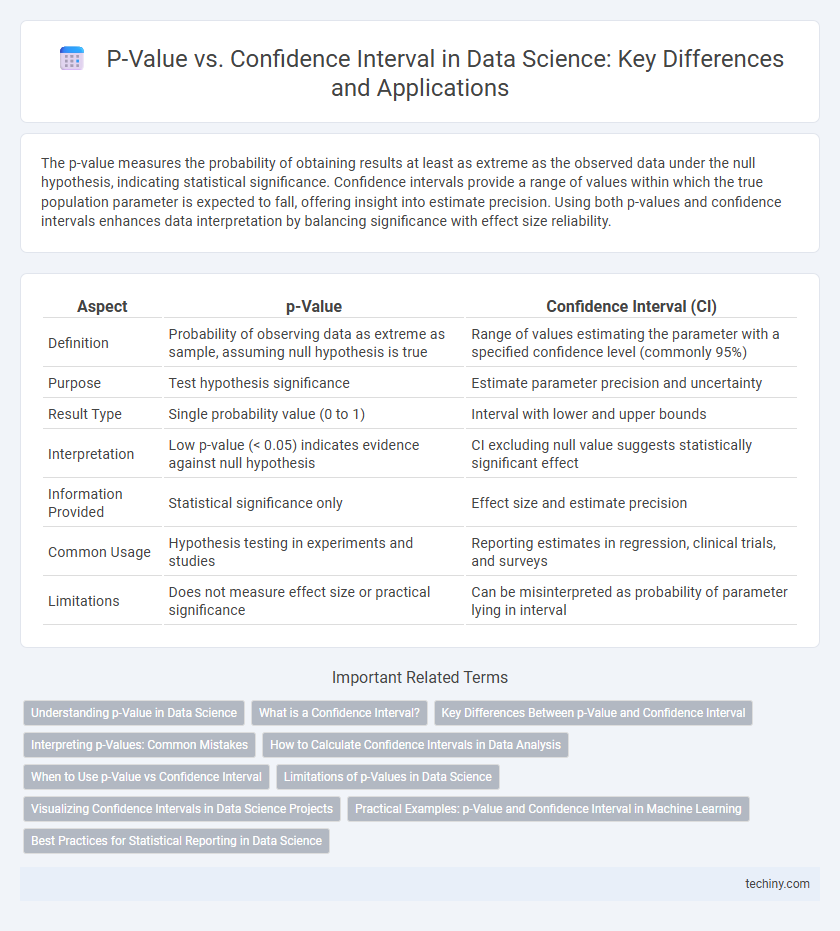
| Aspect | p-Value | Confidence Interval (CI) |
|---|---|---|
| Definition | Probability of observing data as extreme as sample, assuming null hypothesis is true | Range of values estimating the parameter with a specified confidence level (commonly 95%) |
| Purpose | Test hypothesis significance | Estimate parameter precision and uncertainty |
| Result Type | Single probability value (0 to 1) | Interval with lower and upper bounds |
| Interpretation | Low p-value (< 0.05) indicates evidence against null hypothesis | CI excluding null value suggests statistically significant effect |
| Information Provided | Statistical significance only | Effect size and estimate precision |
| Common Usage | Hypothesis testing in experiments and studies | Reporting estimates in regression, clinical trials, and surveys |
| Limitations | Does not measure effect size or practical significance | Can be misinterpreted as probability of parameter lying in interval |
Understanding p-Value in Data Science
The p-value in data science quantifies the probability of observing data at least as extreme as the sample under the null hypothesis, aiding in hypothesis testing decisions. It helps determine statistical significance by comparing the p-value with a predefined significance level, often 0.05, to reject or fail to reject the null hypothesis. Unlike confidence intervals that estimate parameter ranges, the p-value directly measures evidence against the null hypothesis.
What is a Confidence Interval?
A confidence interval is a range of values, derived from sample data, that is likely to contain the true population parameter with a specified level of confidence, commonly 95%. It quantifies the uncertainty around an estimate by providing an upper and lower bound, offering insight into the precision and variability of the statistical measure. Unlike the p-value, which tests a hypothesis, the confidence interval provides a range that reflects the estimate's reliability for inference in data science.
Key Differences Between p-Value and Confidence Interval
The p-value measures the probability of observing data as extreme as the sample data under the null hypothesis, indicating statistical significance by quantifying evidence against it. In contrast, a confidence interval provides a range of plausible values for an estimated parameter, reflecting the precision and uncertainty around the estimate. While the p-value offers a binary significance outcome, the confidence interval delivers more information about effect size and variability, aiding in interpreting practical significance in data science analyses.
Interpreting p-Values: Common Mistakes
Misinterpreting p-values often leads to incorrect conclusions about statistical significance; a p-value does not measure the probability that the null hypothesis is true or the size of an effect. Researchers frequently mistake a p-value below 0.05 as definitive proof of practical importance, overlooking confidence intervals that provide essential information about estimate precision and effect size variability. Emphasizing both p-values and confidence intervals enhances the robustness of hypothesis testing and supports more nuanced interpretations in data science analysis.
How to Calculate Confidence Intervals in Data Analysis
Calculate confidence intervals in data analysis by first determining the sample mean and standard error based on the collected data. Use the appropriate z-score or t-score corresponding to the desired confidence level (e.g., 95%) to compute the margin of error by multiplying this score with the standard error. Construct the confidence interval by adding and subtracting the margin of error from the sample mean, providing a range within which the true population parameter is likely to fall.
When to Use p-Value vs Confidence Interval
P-values are essential for hypothesis testing when determining the statistical significance of an observed effect, indicating whether to reject the null hypothesis. Confidence intervals quantify the range within which the true population parameter lies with a specified level of confidence, providing insight into estimate precision. Use p-values for binary decision-making in hypothesis tests, and confidence intervals for estimating the magnitude and uncertainty of effects in data science analyses.
Limitations of p-Values in Data Science
P-values often mislead by suggesting binary decisions about hypotheses without conveying the effect size or practical significance, which can result in misinterpretation of results. They are sensitive to sample size, causing small differences to appear statistically significant in large datasets, a common issue in data science projects. Confidence intervals provide a more informative range estimate but do not fix the fundamental problems of p-values related to reliance on arbitrary thresholds and lack of context about data variability.
Visualizing Confidence Intervals in Data Science Projects
Visualizing confidence intervals in data science projects provides a clear representation of the range within which a population parameter lies with a given level of confidence, typically 95%. Unlike p-values, which indicate the probability of observing the data assuming the null hypothesis is true, confidence intervals offer insight into the precision and reliability of parameter estimates. Effective visualization methods include error bars on bar charts, shaded regions in line graphs, and violin plots that convey uncertainty and support more informed decision-making.
Practical Examples: p-Value and Confidence Interval in Machine Learning
In machine learning, p-values quantify the probability of observing results at least as extreme as the data assuming the null hypothesis is true, often used to test feature significance in models. Confidence intervals provide a range of plausible values for model parameters, such as coefficients in linear regression, offering insights into the precision and reliability of estimates. For example, a low p-value for a feature combined with a narrow confidence interval around its coefficient indicates strong evidence that the feature has a significant effect on the target variable.
Best Practices for Statistical Reporting in Data Science
Best practices for statistical reporting in data science emphasize reporting both p-values and confidence intervals to provide a comprehensive understanding of results. P-values indicate the strength of evidence against a null hypothesis, while confidence intervals offer a range of plausible effect sizes, enhancing interpretability and practical significance. Transparent reporting includes specifying significance levels, avoiding sole reliance on p-values, and contextualizing intervals to support data-driven decisions.
p-value vs confidence interval Infographic