Multicollinearity occurs in data science when predictor variables in a regression model are highly correlated, leading to unreliable coefficient estimates and inflated standard errors. Autocorrelation refers to the correlation of a variable with its own past values, often observed in time series data, which violates the assumption of independent errors in regression analysis. Detecting and addressing multicollinearity and autocorrelation is essential for improving model accuracy and interpretability in data science projects.
Table of Comparison
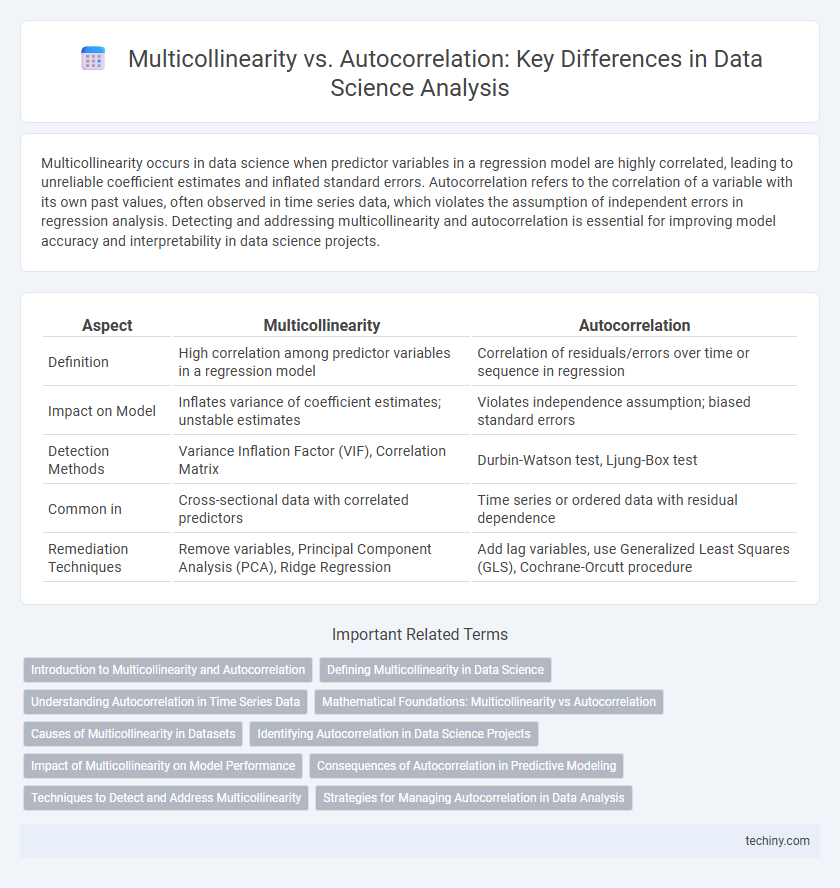
| Aspect | Multicollinearity | Autocorrelation |
|---|---|---|
| Definition | High correlation among predictor variables in a regression model | Correlation of residuals/errors over time or sequence in regression |
| Impact on Model | Inflates variance of coefficient estimates; unstable estimates | Violates independence assumption; biased standard errors |
| Detection Methods | Variance Inflation Factor (VIF), Correlation Matrix | Durbin-Watson test, Ljung-Box test |
| Common in | Cross-sectional data with correlated predictors | Time series or ordered data with residual dependence |
| Remediation Techniques | Remove variables, Principal Component Analysis (PCA), Ridge Regression | Add lag variables, use Generalized Least Squares (GLS), Cochrane-Orcutt procedure |
Introduction to Multicollinearity and Autocorrelation
Multicollinearity refers to a situation in data science where two or more predictor variables in a regression model are highly correlated, causing redundancy and instability in coefficient estimates. Autocorrelation describes the correlation of a variable with its own past values in time series data, impacting the independence assumption of regression errors. Both phenomena can significantly affect model accuracy, interpretation, and inference in predictive analytics.
Defining Multicollinearity in Data Science
Multicollinearity in data science refers to a statistical phenomenon where two or more predictor variables in a regression model exhibit high correlation, leading to redundancy and unstable coefficient estimates. This issue complicates the interpretation of individual variable effects and inflates the variance of parameter estimates, undermining model reliability. Detecting multicollinearity typically involves examining variance inflation factors (VIF) or correlation matrices to ensure predictor independence.
Understanding Autocorrelation in Time Series Data
Autocorrelation in time series data refers to the correlation of a variable with its own past values, revealing patterns such as trends or seasonal effects over time. Detecting autocorrelation is crucial for building accurate predictive models because it violates the assumption of independent errors in regression analysis. Tools like the Durbin-Watson test and correlograms help identify autocorrelation, enabling data scientists to adjust models with techniques such as differencing or adding lag variables.
Mathematical Foundations: Multicollinearity vs Autocorrelation
Multicollinearity occurs when predictor variables in a regression model exhibit high linear correlation, causing instability in coefficient estimates by inflating variance and leading to unreliable statistical inferences. Autocorrelation refers to the correlation of error terms or residuals across observations spaced in time or space, violating the assumption of independence and impacting the efficiency of estimators in time series or spatial models. Mathematically, multicollinearity is detected through metrics like the Variance Inflation Factor (VIF), while autocorrelation is examined using tests such as the Durbin-Watson statistic and autocorrelation function plots.
Causes of Multicollinearity in Datasets
Multicollinearity in datasets arises primarily from high correlations between predictor variables, often due to redundant or overlapping features capturing similar information. It can also be caused by data collection methods that do not ensure independent variable selection, or by including interaction or polynomial terms without proper feature engineering. Detecting multicollinearity involves examining correlation matrices, variance inflation factors (VIF), and eigenvalues of the design matrix in regression models.
Identifying Autocorrelation in Data Science Projects
Autocorrelation in data science projects is identified by examining the correlation of a variable with its own past values, often using the Durbin-Watson statistic or autocorrelation function (ACF) plots. Detecting autocorrelation is critical for time series analysis and regression diagnostics as it violates the independence assumption, potentially leading to inefficient estimators and biased significance tests. Tools like the Ljung-Box test further assess the presence of autocorrelation at different lags, ensuring model robustness and accurate forecasting.
Impact of Multicollinearity on Model Performance
Multicollinearity inflates the variance of coefficient estimates, making them unstable and unreliable, which reduces the interpretability of the model. It can cause significant deviations in parameter estimates, leading to less precise predictions and difficulty in identifying the true relationship between variables. This issue can degrade model performance by increasing standard errors and complicating the determination of variable importance in regression analysis.
Consequences of Autocorrelation in Predictive Modeling
Autocorrelation in predictive modeling often leads to underestimated standard errors, resulting in overly optimistic confidence intervals and unreliable hypothesis tests. This violation of the independence assumption inflates the risk of Type I errors, compromising the model's statistical significance. Moreover, it can cause biased parameter estimates, reducing the model's predictive accuracy and generalizability across datasets.
Techniques to Detect and Address Multicollinearity
Multicollinearity in data science can be detected using techniques such as Variance Inflation Factor (VIF), Condition Index, and correlation matrices to identify highly correlated independent variables. Addressing multicollinearity involves methods like removing or combining correlated predictors, applying Principal Component Analysis (PCA), or using regularization techniques such as Ridge Regression and Lasso. These approaches enhance model stability and improve the interpretability of regression coefficients.
Strategies for Managing Autocorrelation in Data Analysis
Managing autocorrelation in data analysis requires applying techniques like the Durbin-Watson test to detect its presence and using methods such as differencing or transforming variables to achieve stationarity. Incorporating autoregressive integrated moving average (ARIMA) models or generalized least squares (GLS) can effectively model and correct autocorrelation in time series data. Employing robust standard errors and lagged variables further mitigates the impact of autocorrelation on model accuracy and inference validity.
Multicollinearity vs Autocorrelation Infographic