Logistic regression is used for binary classification problems by predicting probabilities and applying a sigmoid function to map outputs between 0 and 1. Linear regression models continuous numerical values by fitting a linear relationship between input features and the target variable. While linear regression minimizes the mean squared error, logistic regression optimizes the likelihood function through maximum likelihood estimation.
Table of Comparison
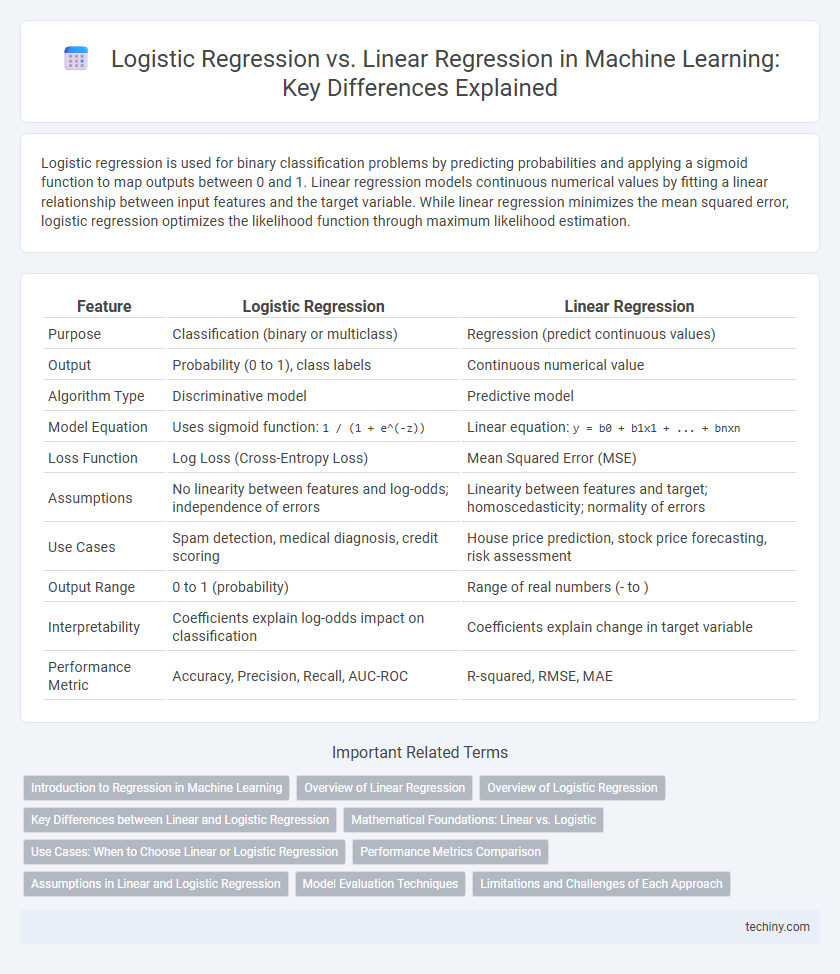
| Feature | Logistic Regression | Linear Regression |
|---|---|---|
| Purpose | Classification (binary or multiclass) | Regression (predict continuous values) |
| Output | Probability (0 to 1), class labels | Continuous numerical value |
| Algorithm Type | Discriminative model | Predictive model |
| Model Equation | Uses sigmoid function: 1 / (1 + e^(-z)) |
Linear equation: y = b0 + b1x1 + ... + bnxn |
| Loss Function | Log Loss (Cross-Entropy Loss) | Mean Squared Error (MSE) |
| Assumptions | No linearity between features and log-odds; independence of errors | Linearity between features and target; homoscedasticity; normality of errors |
| Use Cases | Spam detection, medical diagnosis, credit scoring | House price prediction, stock price forecasting, risk assessment |
| Output Range | 0 to 1 (probability) | Range of real numbers (- to ) |
| Interpretability | Coefficients explain log-odds impact on classification | Coefficients explain change in target variable |
| Performance Metric | Accuracy, Precision, Recall, AUC-ROC | R-squared, RMSE, MAE |
Introduction to Regression in Machine Learning
Logistic regression and linear regression are fundamental algorithms in machine learning used for predictive modeling. Linear regression predicts continuous numerical outcomes by fitting a linear relationship between independent variables and the target variable. Logistic regression, on the other hand, is used for binary classification tasks by estimating probabilities through the logistic function, allowing the model to distinguish between classes.
Overview of Linear Regression
Linear Regression is a fundamental supervised learning algorithm used for predicting continuous target variables by modeling the relationship between independent variables and a dependent variable through a best-fit line. It minimizes the sum of squared errors between observed and predicted values, optimizing model accuracy using methods like Ordinary Least Squares (OLS). Widely applied in regression tasks, Linear Regression assumes a linear relationship and is sensitive to outliers and multicollinearity among features.
Overview of Logistic Regression
Logistic regression is a supervised learning algorithm used for binary classification tasks by modeling the probability that a given input belongs to a particular class using the logistic function. It outputs values between 0 and 1, representing class probabilities, making it especially suitable for scenarios where the dependent variable is categorical. Unlike linear regression which predicts continuous outcomes, logistic regression uses maximum likelihood estimation to fit the model and handle non-linear decision boundaries effectively.
Key Differences between Linear and Logistic Regression
Linear regression predicts continuous numerical outcomes by fitting a linear relationship between independent variables and the dependent variable, minimizing the mean squared error. Logistic regression, however, is used for binary classification problems, estimating probabilities using the logistic sigmoid function to model the relationship between input features and discrete target classes. The primary distinction lies in their output: linear regression outputs a continuous value, whereas logistic regression outputs a probability bounded between 0 and 1 for classification tasks.
Mathematical Foundations: Linear vs. Logistic
Linear regression models the relationship between a dependent variable and one or more independent variables by fitting a linear equation using the least squares method, optimizing parameters to minimize the sum of squared errors. Logistic regression, instead of predicting continuous outcomes, estimates probabilities using the logistic function applied to a linear combination of input features, optimizing parameters via maximum likelihood estimation to classify binary outcomes. The key mathematical distinction lies in linear regression's direct mapping to real-valued outputs versus logistic regression's transformation of linear combinations into bounded probability values through the sigmoid function.
Use Cases: When to Choose Linear or Logistic Regression
Linear regression is ideal for predicting continuous numerical outcomes such as house prices, sales forecasts, or temperature trends, where the relationship between variables is linear. Logistic regression excels in classification problems involving binary or categorical dependent variables, such as spam detection, disease diagnosis, or customer churn prediction. Choosing between the two models depends on the nature of the target variable: use linear regression for regression tasks and logistic regression for classification tasks.
Performance Metrics Comparison
Logistic regression uses accuracy, precision, recall, F1-score, and AUC-ROC as primary performance metrics, effectively evaluating classification tasks by measuring true positive and false positive rates. Linear regression relies on metrics such as mean squared error (MSE), root mean squared error (RMSE), mean absolute error (MAE), and R-squared to assess how well the model predicts continuous outcomes by quantifying prediction errors. The choice of performance metrics directly depends on whether the problem is classification, favoring logistic regression's probabilistic outputs, or regression, where linear regression's error minimization is key.
Assumptions in Linear and Logistic Regression
Linear regression assumes a linear relationship between independent variables and a continuous dependent variable, normality of residuals, homoscedasticity, and independence of errors. Logistic regression assumes a binary dependent variable, the log-odds of the outcome being a linear combination of predictors, independence of observations, and no multicollinearity among predictors. Both models require the absence of strongly influential outliers but differ fundamentally in how the dependent variable is modeled.
Model Evaluation Techniques
Logistic regression model evaluation primarily uses metrics such as accuracy, precision, recall, F1-score, and the area under the ROC curve (AUC-ROC) to assess classification performance. Linear regression relies on evaluation metrics like mean squared error (MSE), root mean squared error (RMSE), mean absolute error (MAE), and R-squared (coefficient of determination) to measure prediction accuracy and goodness of fit. Confusion matrix analysis is critical for logistic regression, while residual analysis and variance inflation factor (VIF) play a significant role in evaluating linear regression models.
Limitations and Challenges of Each Approach
Logistic regression faces challenges with non-linearly separable data and can struggle with multi-class classification without extensions, while linear regression assumes a linear relationship between features and the target variable, limiting its accuracy on complex datasets. Both models are sensitive to outliers, which can significantly skew results and reduce predictive performance. Logistic regression requires larger datasets for stable probability estimates, whereas linear regression's assumptions of homoscedasticity and normality often do not hold in real-world scenarios, leading to biased or inefficient estimates.
Logistic Regression vs Linear Regression Infographic